Tyson Foods 2009 Annual Report Download - page 40
Download and view the complete annual report
Please find page 40 of the 2009 Tyson Foods annual report below. You can navigate through the pages in the report by either clicking on the pages listed below, or by using the keyword search tool below to find specific information within the annual report.-
 1
1 -
2
-
3
-
4
-
5
-
6
-
7
-
8
-
9
-
10
-
11
-
12
-
13
-
14
-
15
-
16
-
17
-
18
-
19
-
20
-
21
-
22
-
23
-
24
-
25
-
26
-
27
-
28
-
29
-
 30
30 -
 31
31 -
 32
32 -
 33
33 -
 34
34 -
 35
35 -
 36
36 -
 37
37 -
 38
38 -
 39
39 -
 40
40 -
 41
41 -
 42
42 -
 43
43 -
 44
44 -
 45
45 -
 46
46 -
 47
47 -
 48
48 -
 49
49 -
 50
50 -
51
-
52
-
53
-
54
-
55
-
56
-
57
-
58
-
59
-
60
-
61
-
62
-
63
-
64
-
65
-
66
-
67
-
68
-
69
-
70
-
71
-
72
-
73
-
74
-
75
-
76
-
77
-
78
-
79
-
80
-
81
-
82
-
83
-
84
-
85
-
86
-
87
-
88
-
89
-
90
-
91
-
92
 |
 |
40
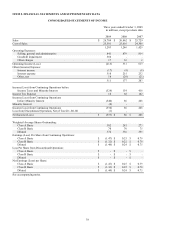
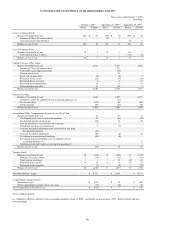
CONSOLIDATED STATEMENTS OF SHAREHOLDERS’ EQUITY
Three years ended October 3, 2009
in millions
October 3, 2009
September 27, 2008
September 29, 2007
Shares
Amount
Shares
Amount
Shares
Amount
Class A Common Stock:
Balance at beginning of year
322
$
32
300
$
30
284
$
28
Issuance of Class A Common Stock
-
-
22
2
-
-
Conversion from Class B shares
-
-
-
-
16
2
Balance at end of year
322
32
322
32
300
30
Class B Common Stock:
Balance at beginning of year
70
7
70
7
86
9
Conversion to Class A shares
-
-
-
-
(16
)
(2
)
Balance at end of year
70
7
70
7
70
7
Capital in Excess of Par Value:
Balance at beginning of year
2,161
1,877
1,835
Issuance of Class A Common Stock
-
272
-
Convertible note hedge transactions
-
(58
)
-
Warrant transactions
-
44
-
Stock options exercised
(5
)
(5
)
9
Restricted shares issued
(12
)
(14
)
(26
)
Restricted shares canceled
2
2
27
Restricted share amortization
19
19
24
Reclassification and other
15
24
8
Balance at end of year
2,180
2,161
1,877
Retained Earnings:
Balance at beginning of year
3,006
2,993
2,781
Cumulative effect for adoption of new accounting guidance (1)
-
(17
)
-
Net income (loss)
(537
)
86
268
Dividends paid
(60
)
(56
)
(56
)
Balance at end of year
2,409
3,006
2,993
Accumulated Other Comprehensive Income (Loss), Net of Tax:
Balance at beginning of year
41
50
17
Net hedging (gain) loss recognized in earnings
36
(25
)
(20
)
Net hedging unrealized gain (loss)
(30
)
23
20
Loss on investments reclassified to other income
3
-
-
Unrealized gain (loss) on investments
7
(1
)
-
Currency translation adjustment gain reclassified to loss from
discontinued operation
(41
)
-
-
Currency translation adjustment
(40
)
(2
)
24
Net change in postretirement liabilities
(10
)
(4
)
-
Net change in pension liability, prior to adoption of new
accounting guidance (1)
-
-
6
Adjustment to initially apply new accounting guidance (1)
-
-
3
Balance at end of year
(34
)
41
50
Treasury Stock:
Balance at beginning of year
15
(233
)
14
(226
)
15
(230
)
Purchase of treasury shares
2
(19
)
2
(30
)
3
(61
)
Stock options exercised
-
1
-
11
(4
)
65
Restricted shares issued
(1
)
12
(1
)
16
(2
)
27
Restricted shares canceled
-
(3
)
-
(4
)
2
(27
)
Balance at end of year
16
(242
)
15
(233
)
14
(226
)
Total Shareholders’ Equity
$
4,352
$
5,014
$
4,731
Comprehensive Income (Loss):
Net income (loss)
$
(537
)
$
86
$
268
Other comprehensive income (loss), net of tax
(75
)
(9
)
30
Total Comprehensive Income (Loss)
$
(612
)
$
77
$
298
See accompanying notes.
(1) Cumulative effect for adoption of new accounting guidance relates to: 2008 – uncertainty in income taxes; 2007 – defined benefit and post
retirement plans