Tyson Foods 2009 Annual Report Download - page 60
Download and view the complete annual report
Please find page 60 of the 2009 Tyson Foods annual report below. You can navigate through the pages in the report by either clicking on the pages listed below, or by using the keyword search tool below to find specific information within the annual report.-
 1
1 -
2
-
3
-
4
-
5
-
6
-
7
-
8
-
9
-
10
-
11
-
12
-
13
-
14
-
15
-
16
-
17
-
18
-
19
-
20
-
21
-
22
-
23
-
24
-
25
-
26
-
27
-
28
-
29
-
30
-
31
-
32
-
33
-
34
-
35
-
36
-
37
-
38
-
39
-
40
-
41
-
42
-
43
-
44
-
45
-
46
-
47
-
48
-
49
-
 50
50 -
 51
51 -
 52
52 -
 53
53 -
 54
54 -
 55
55 -
 56
56 -
 57
57 -
 58
58 -
 59
59 -
 60
60 -
 61
61 -
 62
62 -
 63
63 -
 64
64 -
 65
65 -
 66
66 -
 67
67 -
 68
68 -
 69
69 -
 70
70 -
71
-
72
-
73
-
74
-
75
-
76
-
77
-
78
-
79
-
80
-
81
-
82
-
83
-
84
-
85
-
86
-
87
-
88
-
89
-
90
-
91
-
92
 |
 |

60
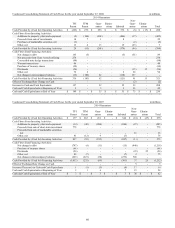
Condensed Consolidating Statement of Cash Flows for the year ended September 27, 2008
in millions
2014 Guarantors
TFI
Parent
TFM
Parent
Guar-
antors
Elimin-
ations
Subtotal
Non-
Guar-
antors
Elimin-
ations
Total
Cash Provided by (Used for) Operating Activities
$
(223
)
$
276
$
256
$
-
$
532
$
(6
)
$
(15
)
$
288
Cash Flows From Investing Activities:
Additions to property, plant and equipment
(2
)
(104
)
(302
)
-
(406
)
(17
)
-
(425
)
Proceeds from sale of investments
14
7
1
-
8
-
-
22
Purchases of marketable securities, net
(1
)
-
-
-
-
(2
)
-
(3
)
Other, net
13
4
15
-
19
(25
)
-
7
Cash Provided by (Used for) Investing Activities
24
(93
)
(286
)
-
(379
)
(44
)
-
(399
)
Cash Flows from Financing Activities:
Net change in debt
145
(5
)
-
-
(5
)
(51
)
-
89
Net proceeds from Class A stock offering
274
-
-
-
-
-
-
274
Convertible note hedge transactions
(94
)
-
-
-
-
-
-
(94
)
Warrant transactions
44
-
-
-
-
-
-
44
Purchase of treasury shares
(30
)
-
-
-
-
-
-
(30
)
Dividends
(56
)
-
-
-
-
(15
)
15
(56
)
Other, net
72
2
-
-
2
20
-
94
Net change in intercompany balances
(19
)
(180
)
62
-
(118
)
137
-
-
Cash Provided by (Used for) Financing Activities
336
(183
)
62
-
(121
)
91
15
321
Effect of Exchange Rate Change on Cash
-
-
-
-
-
(2
)
-
(2
)
Increase in Cash and Cash Equivalents
137
-
32
-
32
39
-
208
Cash and Cash Equivalents at Beginning of Year
3
-
3
-
3
36
-
42
Cash and Cash Equivalents at End of Year
$
140
$
-
$
35
$
-
$
35
$
75
$
-
$
250
Condensed Consolidating Statement of Cash Flows for the year ended September 29, 2007
in millions
2014 Guarantors
TFI
Parent
TFM
Parent
Guar-
antors
Elimin-
ations
Subtotal
Non-
Guar-
antors
Elimin-
ations
Total
Cash Provided by (Used for) Operating Activities
$
177
$
283
$
261
$
-
$
544
$
(18
)
$
(25
)
$
678
Cash Flows From Investing Activities:
Additions to property, plant and equipment
(14
)
(40
)
(204
)
-
(244
)
(27
)
-
(285
)
Proceeds from sale of short-term investment
770
-
-
-
-
-
-
770
Proceeds from sale of marketable securities,
net
-
-
-
-
-
16
-
16
Other, net
81
(12
)
9
-
(3
)
-
-
78
Cash Provided by (Used for) Investing Activities
837
(52
)
(195
)
-
(247
)
(11
)
-
579
Cash Flows from Financing Activities:
Net change in debt
(747
)
(4
)
(11
)
-
(15
)
(448
)
-
(1,210
)
Purchase of treasury shares
(61
)
-
-
-
-
-
-
(61
)
Dividends
(56
)
-
-
-
-
(25
)
25
(56
)
Other, net
80
(7
)
-
-
(7
)
2
-
75
Net change in intercompany balances
(229
)
(221
)
(58
)
-
(279
)
508
-
-
Cash Provided by (Used for) Financing Activities
(1,013
)
(232
)
(69
)
-
(301
)
37
25
(1,252
)
Effect of Exchange Rate Change on Cash
-
-
-
-
-
9
-
9
Increase (Decrease) in Cash and Cash Equivalents
1
(1
)
(3
)
-
(4
)
17
-
14
Cash and Cash Equivalents at Beginning of Year
2
1
6
-
7
19
-
28
Cash and Cash Equivalents at End of Year
$
3
$
-
$
3
$
-
$
3
$
36
$
-
$
42