Tyson Foods 2009 Annual Report Download - page 23
Download and view the complete annual report
Please find page 23 of the 2009 Tyson Foods annual report below. You can navigate through the pages in the report by either clicking on the pages listed below, or by using the keyword search tool below to find specific information within the annual report.
23
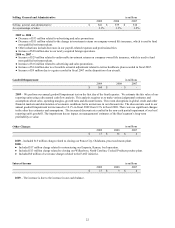
Interest Expense
in millions
2009
2008
2007
Cash interest expense
$
273
$
214
$
229
Non-cash interest expense
37
1
3
Total Interest Expense
$
310
$
215
$
232
2009 vs. 2008 –
●
Cash interest expense includes interest expense related to the coupon rates for senior notes, commitment/letter of credit fees
incurred on our revolving credit facilities, as well as other miscellaneous recurring cash payments. The increase was due
primarily to higher average weekly indebtedness of approximately 13%. We also had an increase in the overall average
borrowing rates.
●
Non-cash interest expense primarily includes interest related to the amortization of debt issuance costs and
discounts/premiums on note issuances. The increase was primarily due to debt issuance costs incurred on the new credit
facility in fiscal 2009, the 10.5% Notes due March 2014 (2014 Notes) issued in fiscal 2009 and amendment fees paid in
December 2008 on our then existing credit agreements. In addition, we had an increase due to the accretion of the debt
discount on the 2014 Notes. Non-cash interest expense also includes an unrealized loss on our interest rate swap and the
gain/loss on bond buybacks.
2008 vs. 2007 – The reduction in cash interest expense was due to a lower average borrowing rate, as well as lower average
weekly indebtedness of approximately 2%.
Other (Income) Expense, net
in millions
2009
2008
2007
$
18
$
(29
)
$
(21
)
2009 – Included $24 million in foreign currency exchange loss.
2008 – Included $18 million non-operating gain related to the sale of an investment.
2007 – Included $14 million in foreign currency exchange gain.
Effective Tax Rate
2009
2008
2007
(2.7
)%
44.6
%
34.6
%
2009 –
●
Reduced the effective tax rate 37.2% due to impairment of goodwill, which is not deductible for income tax purposes.
●
Reduced the effective tax rate 3.9% due to increase in foreign valuation allowances.
●
Increased the effective tax rate 2.3% due to general business credits.
●
Increased the effective tax rate 1.8% due to tax planning in foreign jurisdictions.
2008 –
●
Increased the effective tax rate 5.0% due to increase in state valuation allowances.
●
Increased the effective tax rate 4.4% due to increase in unrecognized tax benefits.
●
Increased the effective tax rate 3.8% due to net negative returns on company-owned life insurance policies, which is not
deductible for federal income tax purposes.
●
Reduced the effective tax rate 3.8% due to general business credits.
2007 –
●
Increased the effective tax rate 4.2% due to a fixed asset tax cost correction, primarily related to a fixed asset system
conversion in 1999.
●
Increased the effective tax rate 3.2% due to the federal income tax effect of the reductions in estimated Medicare Part D
subsidy in fiscal 2007, which is not deductible for federal income tax purposes.
●
Reduced the effective tax rate 4.6% due to the reduction of income tax reserves based on favorable settlement of disputed
matters.


