Tyson Foods 2009 Annual Report Download - page 39
Download and view the complete annual report
Please find page 39 of the 2009 Tyson Foods annual report below. You can navigate through the pages in the report by either clicking on the pages listed below, or by using the keyword search tool below to find specific information within the annual report.-
 1
1 -
2
-
3
-
4
-
5
-
6
-
7
-
8
-
9
-
10
-
11
-
12
-
13
-
14
-
15
-
16
-
17
-
18
-
19
-
20
-
21
-
22
-
23
-
24
-
25
-
26
-
27
-
28
-
 29
29 -
 30
30 -
 31
31 -
 32
32 -
 33
33 -
 34
34 -
 35
35 -
 36
36 -
 37
37 -
 38
38 -
 39
39 -
 40
40 -
 41
41 -
 42
42 -
 43
43 -
 44
44 -
 45
45 -
 46
46 -
 47
47 -
 48
48 -
 49
49 -
50
-
51
-
52
-
53
-
54
-
55
-
56
-
57
-
58
-
59
-
60
-
61
-
62
-
63
-
64
-
65
-
66
-
67
-
68
-
69
-
70
-
71
-
72
-
73
-
74
-
75
-
76
-
77
-
78
-
79
-
80
-
81
-
82
-
83
-
84
-
85
-
86
-
87
-
88
-
89
-
90
-
91
-
92
 |
 |

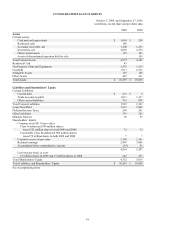
39
CONSOLIDATED BALANCE SHEETS
October 3, 2009, and September 27, 2008
in millions, except share and per share data
2009
2008
Assets
Current Assets:
Cash and cash equivalents
$
1,004
$
250
Restricted cash
140
-
Accounts receivable, net
1,100
1,271
Inventories, net
2,009
2,538
Other current assets
122
143
Assets of discontinued operation held for sale
-
159
Total Current Assets
4,375
4,361
Restricted Cash
43
-
Net Property, Plant and Equipment
3,576
3,519
Goodwill
1,917
2,511
Intangible Assets
187
128
Other Assets
497
331
Total Assets
$
10,595
$
10,850
Liabilities and Shareholders’ Equity
Current Liabilities:
Current debt
$
219
$
8
Trade accounts payable
1,013
1,217
Other current liabilities
761
878
Total Current Liabilities
1,993
2,103
Long-Term Debt
3,333
2,888
Deferred Income Taxes
280
291
Other Liabilities
539
525
Minority Interest
98
29
Shareholders’ Equity:
Common stock ($0.10 par value):
Class A-authorized 900 million shares:
issued 322 million shares in both 2009 and 2008
32
32
Convertible Class B-authorized 900 million shares:
issued 70 million shares in both 2009 and 2008
7
7
Capital in excess of par value
2,180
2,161
Retained earnings
2,409
3,006
Accumulated other comprehensive income
(34
)
41
4,594
5,247
Less treasury stock, at cost-
16 million shares in 2009 and 15 million shares in 2008
242
233
Total Shareholders’ Equity
4,352
5,014
Total Liabilities and Shareholders’ Equity
$
10,595
$
10,850
See accompanying notes.