Tyson Foods 2009 Annual Report Download - page 26
Download and view the complete annual report
Please find page 26 of the 2009 Tyson Foods annual report below. You can navigate through the pages in the report by either clicking on the pages listed below, or by using the keyword search tool below to find specific information within the annual report.-
 1
1 -
2
-
3
-
4
-
5
-
6
-
7
-
8
-
9
-
10
-
11
-
12
-
13
-
14
-
15
-
 16
16 -
 17
17 -
 18
18 -
 19
19 -
 20
20 -
 21
21 -
 22
22 -
 23
23 -
 24
24 -
 25
25 -
 26
26 -
 27
27 -
 28
28 -
 29
29 -
 30
30 -
 31
31 -
 32
32 -
 33
33 -
 34
34 -
 35
35 -
 36
36 -
37
-
38
-
39
-
40
-
41
-
42
-
43
-
44
-
45
-
46
-
47
-
48
-
49
-
50
-
51
-
52
-
53
-
54
-
55
-
56
-
57
-
58
-
59
-
60
-
61
-
62
-
63
-
64
-
65
-
66
-
67
-
68
-
69
-
70
-
71
-
72
-
73
-
74
-
75
-
76
-
77
-
78
-
79
-
80
-
81
-
82
-
83
-
84
-
85
-
86
-
87
-
88
-
89
-
90
-
91
-
92
 |
 |

26
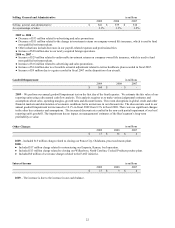
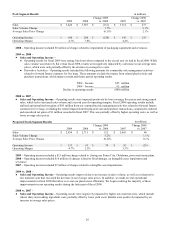
Pork Segment Results
in millions
2009
2008
Change 2009
vs. 2008
2007
Change 2008
vs. 2007
Sales
$
3,426
$
3,587
$
(161
)
$
3,314
$
273
Sales Volume Change
1.7
%
6.1
%
Average Sales Price Change
(6.1
)%
2.1
%
Operating Income
$
160
$
280
$
(120
)
$
145
$
135
Operating Margin
4.7
%
7.8
%
4.4
%
2008 – Operating income included $5 million of charges related to impairment of packaging equipment and severance.
2009 vs. 2008 –
●
Sales and Operating Income –
●
Operating results for fiscal 2009 were strong, but down when compared to the record year we had in fiscal 2008. While
sales volume was relatively flat versus fiscal 2008, results were negatively impacted by a decrease in our average sales
prices, which were only partially offset by the decrease in average live costs.
●
Derivative Activities – Operating results included the following amounts for commodity risk management activities
related to forward futures contracts for live hogs. These amounts exclude the impact from related physical sale and
purchase transactions, which impact current and future period operating results.
2009 – Income
$55 million
2008 – Income
95 million
Decline in operating results
($40) million
2008 vs. 2007 –
●
Sales and Operating Income – Operating results were impacted positively by lower average live prices and strong export
sales, which led to increased sales volume and a record year for operating margins. Fiscal 2008 operating results include
realized and unrealized net gains of $95 million from our commodity risk management activities related to forward futures
contracts for live hogs, excluding the related impact from the physical sale and purchase transactions, compared to realized
and unrealized net gains of $3 million recorded in fiscal 2007. This was partially offset by higher operating costs, as well as
lower average sales prices.
Prepared Foods Segment Results
in millions
2009
2008
Change 2009
vs. 2008
2007
Change 2008
vs. 2007
Sales
$
2,836
$
2,711
$
125
$
2,665
$
46
Sales Volume Change
5.2
%
1.5
%
Average Sales Price Change
(0.6
)%
0.2
%
Operating Income
$
133
$
63
$
70
$
92
$
(29
)
Operating Margin
4.7
%
2.3
%
3.5
%
2009 – Operating income included a $15 million charge related to closing our Ponca City, Oklahoma, processed meats plant.
2008 – Operating income included $10 million of charges related to flood damage, an intangible asset impairment and
severance.
2007 – Operating income included $7 million of charges related to intangible asset impairments.
2009 vs. 2008 –
●
Sales and Operating Income – Operating results improved due to an increase in sales volume, as well as a reduction in
raw material costs that exceeded the decrease in our average sales prices. In addition, we made several operational
improvements in fiscal
2009 that allow us to run our plants more efficiently. We began realizing the majority of these
improvements in our operating results during the latter part of fiscal 2009.
2008 vs. 2007 –
●
Sales and Operating Income – Operating results were negatively impacted by higher raw material costs, which include
wheat, dairy and cooking ingredient costs, partially offset by lower pork costs. Results were positively impacted by an
increase in average sales prices.