Tyson Foods 2009 Annual Report Download - page 63
Download and view the complete annual report
Please find page 63 of the 2009 Tyson Foods annual report below. You can navigate through the pages in the report by either clicking on the pages listed below, or by using the keyword search tool below to find specific information within the annual report.-
 1
1 -
2
-
3
-
4
-
5
-
6
-
7
-
8
-
9
-
10
-
11
-
12
-
13
-
14
-
15
-
16
-
17
-
18
-
19
-
20
-
21
-
22
-
23
-
24
-
25
-
26
-
27
-
28
-
29
-
30
-
31
-
32
-
33
-
34
-
35
-
36
-
37
-
38
-
39
-
40
-
41
-
42
-
43
-
44
-
45
-
46
-
47
-
48
-
49
-
50
-
51
-
52
-
 53
53 -
 54
54 -
 55
55 -
 56
56 -
 57
57 -
 58
58 -
 59
59 -
 60
60 -
 61
61 -
 62
62 -
 63
63 -
 64
64 -
 65
65 -
 66
66 -
 67
67 -
 68
68 -
 69
69 -
 70
70 -
 71
71 -
 72
72 -
 73
73 -
74
-
75
-
76
-
77
-
78
-
79
-
80
-
81
-
82
-
83
-
84
-
85
-
86
-
87
-
88
-
89
-
90
-
91
-
92
 |
 |

63
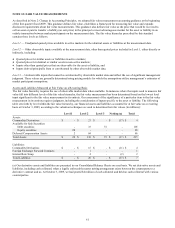
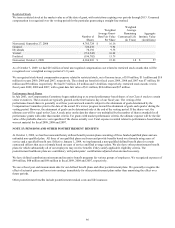
Unrealized holding gains (losses), net of tax, are excluded from earnings and reported in other comprehensive income until the
security is settled or sold. On a quarterly basis, we evaluate whether losses related to our available-for-sale securities are temporary in
nature. If losses are determined to be other than temporary, the loss would be recognized in earnings if we intend, or more likely than
not will be required, to sell the security prior to recovery. For securities in which we have the intent and ability to hold until maturity,
losses determined to be other than temporary would remain in other comprehensive income, other than expected credit losses which
are recognized in earnings. We consider many factors in determining whether a loss is temporary, including the length of time and
extent to which the fair value has been below cost, the financial condition and near-term prospects of the issuer and our ability and
intent to hold the investment for a period of time sufficient to allow for any anticipated recovery. During fiscal 2009, we recognized
$4 million of other than temporary impairments in earnings, while no amounts were recognized during fiscal 2008 and 2007. No other
than temporary losses have been deferred in other comprehensive income as of October 3, 2009.
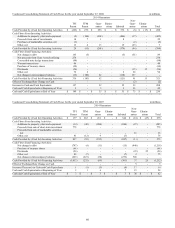
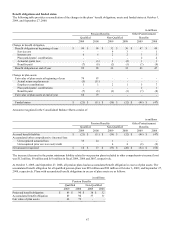
Deferred Compensation Assets: We maintain two non-qualified deferred compensation plans for certain executives and other highly
compensated employees. Investments are maintained within a trust and include money market funds, mutual funds and life insurance
policies. The cash surrender value of the life insurance policies is invested primarily in mutual funds. The investments are recorded at
fair value based on quoted market prices adjusted for credit and non-performance risk and are included in Other Assets in the
Consolidated Balance Sheets. We classify the investments which have observable market prices in active markets in Level 1 as these
are generally publicly-traded mutual funds. The remaining deferred compensation assets are classified in Level 2, as fair value can be
corroborated based on observable market data. Realized and unrealized gains (losses) on deferred compensation are included in
earnings.
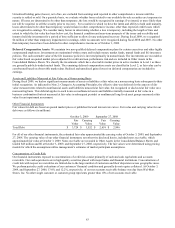
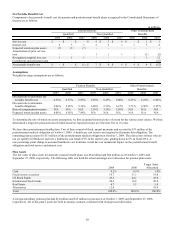
Assets and Liabilities Measured at Fair Value on a Nonrecurring Basis
During fiscal 2009, we had no significant measurements of assets or liabilities at fair value on a nonrecurring basis subsequent to their
initial recognition. As indicated in Note 2: Change in Accounting Principles, the effective date was deferred for the aspects of fair
value measurements related to nonfinancial assets and liabilities measured at fair value, but recognized or disclosed at fair value on a
nonrecurring basis. This deferral applies to such items as nonfinancial assets and liabilities initially measured at fair value in a
business combination (but not measured at fair value in subsequent periods) or nonfinancial long-lived asset groups measured at fair
value for an impairment assessment.
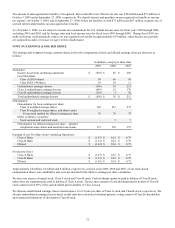
Other Financial Instruments
Fair values for debt are based on quoted market prices or published forward interest rate curves. Fair value and carrying value for our
debt were as follows (in millions):
October 3, 2009
September 27, 2008
Fair
Value
Carrying
Value
Fair
Value
Carrying
Value
Total Debt
$
3,724
$
3,552
$
2,659
$
2,896
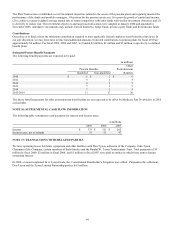
For all of our other financial instruments, the estimated fair value approximated the carrying value at October 3, 2009, and September
27, 2008. The carrying value of our other financial instrument, not otherwise disclosed herein, included notes receivable, which
approximated fair value at October 3, 2009. Notes receivable are recorded in Other Assets in the Consolidated Balance Sheets and
totaled $45 million and $0 at October 3, 2009, and September 27, 2008, respectively. The fair values were determined using pricing
models for which the assumptions utilize management’s estimates of market participant assumptions.
Concentrations of Credit Risk
Our financial instruments exposed to concentrations of credit risk consist primarily of cash and cash equivalents and accounts
receivable. Our cash equivalents are in high quality securities placed with major banks and financial institutions. Concentrations of
credit risk with respect to receivables are limited due to the large number of customers and their dispersion across geographic areas.
We perform periodic credit evaluations of our customers’ financial condition and generally do not require collateral. At October 3,
2009, and September 27, 2008, 13.0% and 12.2%, respectively, of our net accounts receivable balance was due from Wal-Mart
Stores, Inc. No other single customer or customer group represents greater than 10% of net accounts receivable.