Tyson Foods 2009 Annual Report Download - page 65
Download and view the complete annual report
Please find page 65 of the 2009 Tyson Foods annual report below. You can navigate through the pages in the report by either clicking on the pages listed below, or by using the keyword search tool below to find specific information within the annual report.-
 1
1 -
2
-
3
-
4
-
5
-
6
-
7
-
8
-
9
-
10
-
11
-
12
-
13
-
14
-
15
-
16
-
17
-
18
-
19
-
20
-
21
-
22
-
23
-
24
-
25
-
26
-
27
-
28
-
29
-
30
-
31
-
32
-
33
-
34
-
35
-
36
-
37
-
38
-
39
-
40
-
41
-
42
-
43
-
44
-
45
-
46
-
47
-
48
-
49
-
50
-
51
-
52
-
53
-
54
-
 55
55 -
 56
56 -
 57
57 -
 58
58 -
 59
59 -
 60
60 -
 61
61 -
 62
62 -
 63
63 -
 64
64 -
 65
65 -
 66
66 -
 67
67 -
 68
68 -
 69
69 -
 70
70 -
 71
71 -
 72
72 -
 73
73 -
 74
74 -
 75
75 -
76
-
77
-
78
-
79
-
80
-
81
-
82
-
83
-
84
-
85
-
86
-
87
-
88
-
89
-
90
-
91
-
92
 |
 |

65
Shares Under
Option
Weighted
Average
Exercise Price
Per Share
Weighted
Average
Remaining
Contractual Life
(in Years)
Aggregate
Intrinsic Value
(in millions)
Outstanding, September 27, 2008
16,906,014
$
14.38
Exercised
(72,590
)
8.63
Canceled
(1,495,506
)
14.47
Granted
3,255,926
4.90
Outstanding, October 3, 2009
18,593,844
12.73
6.2
$
237
Exercisable, October 3, 2009
10,050,940
$
13.75
4.5
$
138
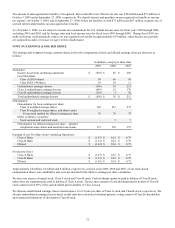
We grant stock options once a year. The grant-date fair value of options granted in fiscal 2009, 2008 and 2007 was $1.29, $5.22 and
$5.85, respectively. The fair value of each option grant is established on the date of grant using a binomial lattice method for grants
awarded after October 1, 2005, and the Black-Scholes option-pricing model for grants awarded before October 1, 2005. The change
to the binomial lattice method was made to better reflect the exercise behavior of top management. We use historical volatility for a
period of time comparable to the expected life of the option to determine volatility assumptions. Expected life is calculated based on
the contractual term of each grant and takes into account the historical exercise and termination behavior of participants. Risk-free
interest rates are based on the five-year Treasury bond rate. Assumptions as of the grant date used in the fair value calculation of each
year’s grants are outlined in the following table.
2009
2008
2007
Expected life
5.3 years
5.8 years
5.4 years
Risk-free interest rate
2.3
%
3.7
%
4.6
%
Expected volatility
34.6
%
30.9
%
33.7
%
Expected dividend yield
3.3
%
1.1
%
1.0
%
We recognized stock-based compensation expense related to stock options, net of income taxes, of $9 million, $12 million and $11
million, respectively, during fiscal years 2009, 2008 and 2007, with a $6 million, $7 million and $6 million related tax benefit. We
had 2.4 million, 2.5 million and 1.9 million options vest in fiscal years 2009, 2008 and 2007, respectively, with a fair value of $15
million, $15 million and $9 million, respectively.
In fiscal years 2009, 2008 and 2007, we received cash of $1 million, $9 million and $59 million, respectively, for the exercise of stock
options. Shares are issued from treasury for stock option exercises. The related tax benefit realized from stock options exercised
during fiscal years 2009, 2008 and 2007, was $0, $1 million and $12 million, respectively. The total intrinsic value of options
exercised in fiscal years 2009, 2008 and 2007, was $0, $3 million and $31 million, respectively. Cash flows resulting from tax
deductions in excess of the compensation cost of those options (excess tax deductions) are classified as financing cash flows. We
realized $0, $0 and $9 million, respectively, in excess tax deductions during fiscal years 2009, 2008 and 2007, respectively. As of
October 3, 2009, we had $29 million of total unrecognized compensation cost related to stock option plans that will be recognized
over a weighted average period of 2.7 years.