Tyson Foods 2009 Annual Report Download - page 21
Download and view the complete annual report
Please find page 21 of the 2009 Tyson Foods annual report below. You can navigate through the pages in the report by either clicking on the pages listed below, or by using the keyword search tool below to find specific information within the annual report.-
 1
1 -
2
-
3
-
4
-
5
-
6
-
7
-
8
-
9
-
10
-
 11
11 -
 12
12 -
 13
13 -
 14
14 -
 15
15 -
 16
16 -
 17
17 -
 18
18 -
 19
19 -
 20
20 -
 21
21 -
 22
22 -
 23
23 -
 24
24 -
 25
25 -
 26
26 -
 27
27 -
 28
28 -
 29
29 -
 30
30 -
 31
31 -
32
-
33
-
34
-
35
-
36
-
37
-
38
-
39
-
40
-
41
-
42
-
43
-
44
-
45
-
46
-
47
-
48
-
49
-
50
-
51
-
52
-
53
-
54
-
55
-
56
-
57
-
58
-
59
-
60
-
61
-
62
-
63
-
64
-
65
-
66
-
67
-
68
-
69
-
70
-
71
-
72
-
73
-
74
-
75
-
76
-
77
-
78
-
79
-
80
-
81
-
82
-
83
-
84
-
85
-
86
-
87
-
88
-
89
-
90
-
91
-
92
 |
 |

21
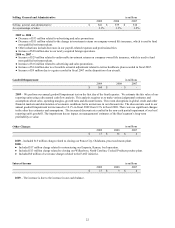
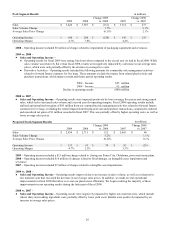
SUMMARY OF RESULTS – CONTINUING OPERATIONS
Sales
in millions
2009
2008
2007
Sales
$
26,704
$
26,862
$
25,729
Change in sales volume
4.4
%
(0.7
)%
Change in average sales price
(4.8
)%
5.1
%
Sales growth (decline)
(0.6
)%
4.4
%
2009 vs. 2008 –
●
Average Sales Price - The decline in sales was largely due to a reduction in average sales prices, which accounted for a
decrease of approximately $1.2 billion. While all segments had a reduction in average sales prices, the majority of the
decrease was driven by the Beef and Pork segments.
●
Sales Volume - Sales were positively impacted by an increase in sales volume, which accounted for an increase of
approximately $1.0 billion. This was primarily due to an extra week in fiscal 2009, increased sales volume in our Chicken
segment, which was driven by inventory reductions, and sales volume related to recent acquisitions.
2008 vs. 2007 –
●
Average Sales Price - The improvement in sales was largely due to improved average sales prices, which accounted for an
increase of approximately $1.5 billion. While all segments had improved average sales prices, the majority of the increase
was driven by the Chicken and Beef segments.
●
Sales Volume - Sales were negatively impacted by a decrease in sales volume, which accounted for a decrease of
approximately $318 million. This was primarily due to a decrease in Beef volume and the sale of two poultry production
facilities in fiscal 2007, partially offset by an increase in Pork volume.
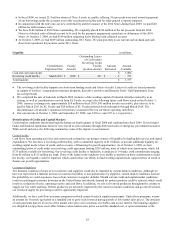
Cost of Sales
in millions
2009
2008
2007
Cost of sales
$
25,501
$
25,616
$
24,300
Gross margin
$
1,203
$
1,246
$
1,429
Cost of sales as a percentage of sales
95.5
%
95.4
%
94.4
%
2009 vs. 2008 –
●
Cost of sales decreased $115 million. Cost per pound contributed to a $1.1 billion decrease, offset partially by an increase in
sales volume increasing cost of sales $987 million.
●
Increase due to net losses of $257 million in fiscal 2009, as compared to net gains of $206 million in fiscal 2008, from our
commodity risk management activities related to grain and energy purchases, which exclude the effect from related
physical purchase transactions which impact current and future period operating results.
●
Increase due to sales volumes, which included an extra week in fiscal 2009, as well as increased sales volume in our
Chicken segment, which was driven by inventory reductions and sales volume related to recent acquisitions.
●
Decrease in average domestic live cattle and hog costs of approximately $1.2 billion.
2008 vs. 2007 –
●
Cost of sales increased $1.3 billion. Cost per pound contributed to a $1.6 billion increase, offset partially by a decrease in
sales volume reducing cost of sales $323 million.
●
Increase of over $1.0 billion in costs in the Chicken segment, which included increased input costs of approximately $900
million, including grain costs, other feed ingredient costs and cooking ingredients. Plant costs, including labor and
logistics, increased by approximately $200 million. These increases were partially offset by increased net gains of $127
million from our commodity risk management activities related to grain purchases, which exclude the impact from related
physical purchase transactions which impact current and future period operating results.
●
Increase in average domestic live cattle costs of approximately $271 million.
●
Increase in operating costs in the Beef and Pork segments of approximately $180 million.
●
Decrease due to sales volume included lower Beef and Chicken sales volume, partially offset by higher Pork sales volume.
●
Decrease due to net gains of $173 million from our commodity risk management activities related to forward futures
contracts for live cattle and hog purchases as compared to the same period of fi
scal 2007. These amounts exclude the
impact from related physical purchase transactions, which impact future period operating results.
●
Decrease in average live hog costs of approximately $117 million.