Tyson Foods 2009 Annual Report Download - page 59
Download and view the complete annual report
Please find page 59 of the 2009 Tyson Foods annual report below. You can navigate through the pages in the report by either clicking on the pages listed below, or by using the keyword search tool below to find specific information within the annual report.-
 1
1 -
2
-
3
-
4
-
5
-
6
-
7
-
8
-
9
-
10
-
11
-
12
-
13
-
14
-
15
-
16
-
17
-
18
-
19
-
20
-
21
-
22
-
23
-
24
-
25
-
26
-
27
-
28
-
29
-
30
-
31
-
32
-
33
-
34
-
35
-
36
-
37
-
38
-
39
-
40
-
41
-
42
-
43
-
44
-
45
-
46
-
47
-
48
-
 49
49 -
 50
50 -
 51
51 -
 52
52 -
 53
53 -
 54
54 -
 55
55 -
 56
56 -
 57
57 -
 58
58 -
 59
59 -
 60
60 -
 61
61 -
 62
62 -
 63
63 -
 64
64 -
 65
65 -
 66
66 -
 67
67 -
 68
68 -
 69
69 -
70
-
71
-
72
-
73
-
74
-
75
-
76
-
77
-
78
-
79
-
80
-
81
-
82
-
83
-
84
-
85
-
86
-
87
-
88
-
89
-
90
-
91
-
92
 |
 |

59
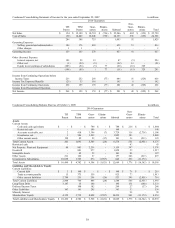
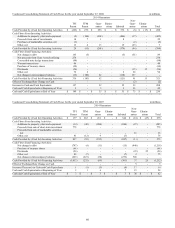
Condensed Consolidating Balance Sheet as of September 27, 2008
in millions
2014 Guarantors
TFI
Parent
TFM
Parent
Guar-
antors
Elimin-
ations
Subtotal
Non-
Guar-
antors
Elimin-
ations
Total
Assets
Current Assets:
Cash and cash equivalents
$
140
$
-
$
35
$
-
$
35
$
75
$
-
$
250
Accounts receivable, net
1
122
3,614
-
3,736
113
(2,579
)
1,271
Inventories, net
1
724
1,640
-
2,364
173
-
2,538
Other current assets
123
55
24
(12
)
67
72
(119
)
143
Assets of discontinued operation held
for sale
-
-
-
-
-
159
-
159
Total Current Assets
265
901
5,313
(12
)
6,202
592
(2,698
)
4,361
Net Property, Plant and Equipment
43
960
2,371
-
3,331
145
-
3,519
Goodwill
-
1,502
965
-
2,467
44
-
2,511
Intangible Assets
-
47
64
-
111
17
-
128
Other Assets
132
91
55
-
146
284
(231
)
331
Investment in Subsidiaries
10,293
1,789
654
(1,639
)
804
282
(11,379
)
-
Total Assets
$
10,733
$
5,290
$
9,422
$
(1,651
)
$
13,061
$
1,364
$
(14,308
)
$
10,850
Liabilities and Shareholders’ Equity
Current Liabilities:
Current debt
$
8
$
-
$
-
$
-
$
-
$
-
$
-
$
8
Trade accounts payable
108
486
559
-
1,045
64
-
1,217
Other current liabilities
2,804
201
282
(12
)
471
301
(2,698
)
878
Total Current Liabilities
2,920
687
841
(12
)
1,516
365
(2,698
)
2,103
Long-Term Debt
2,632
249
180
-
429
7
(180
)
2,888
Deferred Income Taxes
-
129
190
-
319
23
(51
)
291
Other Liabilities
167
137
190
-
327
31
-
525
Minority Interest
-
-
-
-
-
29
-
29
Shareholders’ Equity
5,014
4,088
8,021
(1,639
)
10,470
909
(11,379
)
5,014
Total Liabilities and Shareholders’ Equity
$
10,733
$
5,290
$
9,422
$
(1,651
)
$
13,061
$
1,364
$
(14,308
)
$
10,850
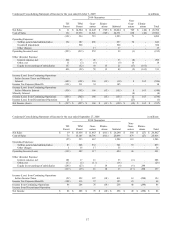
Condensed Consolidating Statement of Cash Flows for the year ended October 3, 2009
in millions
2014 Guarantors
TFI
Parent
TFM
Parent
Guar-
antors
Elimin-
ations
Subtotal
Non-
Guar-
antors
Elimin-
ations
Total
Cash Provided by (Used for) Operating Activities
$
(617
)
$
507
$
1,034
$
-
$
1,541
$
126
$
(25
)
$
1,025
Cash Flows From Investing Activities:
Additions to property, plant and equipment
-
(56
)
(211
)
-
(267
)
(101
)
-
(368
)
Change in restricted cash-investing
-
-
-
-
-
(43
)
-
(43
)
Proceeds from sale of marketable securities,
net
-
-
-
-
-
19
-
19
Proceeds from sale of discontinued operation
-
-
-
-
-
75
-
75
Acquisitions, net of cash acquired
-
-
(13
)
-
(13
)
(80
)
-
(93
)
Other, net
(37
)
1
12
-
13
7
-
(17
)
Cash Used for Investing Activities
(37
)
(55
)
(212
)
-
(267
)
(123
)
-
(427
)
Cash Flows from Financing Activities:
Net change in debt
545
(94
)
-
-
(94
)
36
-
487
Debt issuance costs
(58
)
-
-
-
-
(1
)
-
(59
)
Change in restricted cash-financing
-
-
(140
)
-
(140
)
-
-
(140
)
Purchase of treasury shares
(19
)
-
-
-
-
-
-
(19
)
Dividends
(60
)
-
-
-
-
(25
)
25
(60
)
Other, net
-
-
(52
)
-
(52
)
(7
)
-
(59
)
Net change in intercompany balances
106
(358
)
123
-
(235
)
129
-
-
Cash Provided by (Used for) Financing Activities
514
(452
)
(69
)
-
(521
)
132
25
150
Effect of Exchange Rate Change on Cash
-
-
-
-
-
6
-
6
Increase (Decrease) in Cash and Cash Equivalents
(140
)
-
753
-
753
141
-
754
Cash and Cash Equivalents at Beginning of Year
140
-
35
-
35
75
-
250
Cash and Cash Equivalents at End of Year
$
-
$
-
$
788
$
-
$
788
$
216
$
-
$
1,004