Tyson Foods 2009 Annual Report Download - page 38
Download and view the complete annual report
Please find page 38 of the 2009 Tyson Foods annual report below. You can navigate through the pages in the report by either clicking on the pages listed below, or by using the keyword search tool below to find specific information within the annual report.-
 1
1 -
2
-
3
-
4
-
5
-
6
-
7
-
8
-
9
-
10
-
11
-
12
-
13
-
14
-
15
-
16
-
17
-
18
-
19
-
20
-
21
-
22
-
23
-
24
-
25
-
26
-
27
-
 28
28 -
 29
29 -
 30
30 -
 31
31 -
 32
32 -
 33
33 -
 34
34 -
 35
35 -
 36
36 -
 37
37 -
 38
38 -
 39
39 -
 40
40 -
 41
41 -
 42
42 -
 43
43 -
 44
44 -
 45
45 -
 46
46 -
 47
47 -
 48
48 -
49
-
50
-
51
-
52
-
53
-
54
-
55
-
56
-
57
-
58
-
59
-
60
-
61
-
62
-
63
-
64
-
65
-
66
-
67
-
68
-
69
-
70
-
71
-
72
-
73
-
74
-
75
-
76
-
77
-
78
-
79
-
80
-
81
-
82
-
83
-
84
-
85
-
86
-
87
-
88
-
89
-
90
-
91
-
92
 |
 |

38
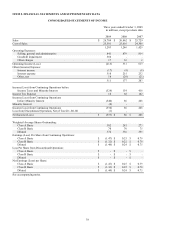
ITEM 8. FINANCIAL STATEMENTS AND SUPPLEMENTARY DATA
CONSOLIDATED STATEMENTS OF INCOME
Three years ended October 3, 2009
in millions, except per share data
2009
2008
2007
Sales
$
26,704
$
26,862
$
25,729
Cost of Sales
25,501
25,616
24,300
1,203
1,246
1,429
Operating Expenses:
Selling, general and administrative
841
879
814
Goodwill impairment
560
-
-
Other charges
17
36
2
Operating Income (Loss)
(215
)
331
613
Other (Income) Expense:
Interest income
(17
)
(9
)
(8
)
Interest expense
310
215
232
Other, net
18
(29
)
(21
)
311
177
203
Income (Loss) from Continuing Operations before
Income Taxes and Minority Interest
(526
)
154
410
Income Tax Expense
14
68
142
Income (Loss) from Continuing Operations
before Minority Interest
(540
)
86
268
Minority Interest
(4
)
-
-
Income (Loss) from Continuing Operations
(536
)
86
268
Loss from Discontinued Operation, Net of Tax $11, $0, $0
(1
)
-
-
Net Income (Loss)
$
(537
)
$
86
$
268
Weighted Average Shares Outstanding:
Class A Basic
302
281
273
Class B Basic
70
70
75
Diluted
372
356
355
Earnings (Loss) Per Share from Continuing Operations:
Class A Basic
$
(1.47
)
$
0.25
$
0.79
Class B Basic
$
(1.32
)
$
0.22
$
0.70
Diluted
$
(1.44
)
$
0.24
$
0.75
Loss Per Share from Discontinued Operation:
Class A Basic
$
-
$
-
$
-
Class B Basic
$
-
$
-
$
-
Diluted
$
-
$
-
$
-
Net Earnings (Loss) per Share:
Class A Basic
$
(1.47
)
$
0.25
$
0.79
Class B Basic
$
(1.32
)
$
0.22
$
0.70
Diluted
$
(1.44
)
$
0.24
$
0.75
See accompanying notes.