Tyson Foods 2009 Annual Report Download - page 67
Download and view the complete annual report
Please find page 67 of the 2009 Tyson Foods annual report below. You can navigate through the pages in the report by either clicking on the pages listed below, or by using the keyword search tool below to find specific information within the annual report.-
 1
1 -
2
-
3
-
4
-
5
-
6
-
7
-
8
-
9
-
10
-
11
-
12
-
13
-
14
-
15
-
16
-
17
-
18
-
19
-
20
-
21
-
22
-
23
-
24
-
25
-
26
-
27
-
28
-
29
-
30
-
31
-
32
-
33
-
34
-
35
-
36
-
37
-
38
-
39
-
40
-
41
-
42
-
43
-
44
-
45
-
46
-
47
-
48
-
49
-
50
-
51
-
52
-
53
-
54
-
55
-
56
-
 57
57 -
 58
58 -
 59
59 -
 60
60 -
 61
61 -
 62
62 -
 63
63 -
 64
64 -
 65
65 -
 66
66 -
 67
67 -
 68
68 -
 69
69 -
 70
70 -
 71
71 -
 72
72 -
 73
73 -
 74
74 -
 75
75 -
 76
76 -
 77
77 -
78
-
79
-
80
-
81
-
82
-
83
-
84
-
85
-
86
-
87
-
88
-
89
-
90
-
91
-
92
 |
 |

67
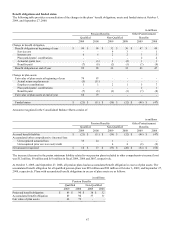
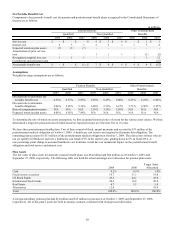
Benefit obligations and funded status
The following table provides a reconciliation of the changes in the plans’ benefit obligations, assets and funded status at October 3,
2009, and September 27, 2008:
in millions
Pension Benefits
Other Postretirement
Qualified
Non-Qualified
Benefits
2009
2008
2009
2008
2009
2008
Change in benefit obligation
Benefit obligation at beginning of year
$
90
$
98
$
32
$
30
$
47
$
49
Service cost
-
-
4
3
-
1
Interest cost
6
6
2
2
3
3
Plan participants’ contributions
-
-
-
-
2
2
Actuarial (gain) loss
-
(6
)
2
(2
)
1
1
Benefits paid
(7
)
(8
)
(2
)
(1
)
(7
)
(9
)
Benefit obligation at end of year
89
90
38
32
46
47
Change in plan assets
Fair value of plan assets at beginning of year
79
97
-
-
-
-
Actual return on plan assets
(5
)
(11
)
-
-
-
-
Employer contributions
1
1
2
1
5
7
Plan participants’ contributions
-
-
-
-
2
1
Benefits paid
(7
)
(8
)
(2
)
(1
)
(7
)
(8
)
Fair value of plan assets at end of year
68
79
-
-
-
-
Funded status
$
(21
)
$
(11
)
$
(38
)
$
(32
)
$
(46
)
$
(47
)
Amounts recognized in the Consolidated Balance Sheets consist of:
in millions
Pension Benefits
Other Postretirement
Qualified
Non-Qualified
Benefits
2009
2008
2009
2008
2009
2008
Accrued benefit liability
$
(21
)
$
(11
)
$
(38
)
$
(32
)
$
(46
)
$
(47
)
Accumulated other comprehensive (income)/loss:
Unrecognized actuarial loss
35
24
1
-
-
-
Unrecognized prior service (cost)/credit
-
-
4
4
(8
)
(9
)
Net amount recognized
$
14
$
13
$
(33
)
$
(28
)
$
(54
)
$
(56
)
The increase (decrease) in the pretax minimum liability related to our pension plans included in other comprehensive income (loss)
was $12 million, $9 million and $(9) million in fiscal 2009, 2008 and 2007, respectively.
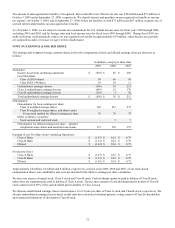
At October 3, 2009, and September 27, 2008, all pension plans had an accumulated benefit obligation in excess of plan assets. The
accumulated benefit obligation for all qualified pension plans was $89 million and $90 million at October 3, 2009, and September 27,
2008, respectively. Plans with accumulated benefit obligations in excess of plan assets are as follows:
in millions
Pension Benefits
Qualified
Non-Qualified
2009
2008
2009
2008
Projected benefit obligation
$
89
$
90
$
38
$
32
Accumulated benefit obligation
89
90
37
31
Fair value of plan assets
68
79
-
-