Tyson Foods 2009 Annual Report Download - page 51
Download and view the complete annual report
Please find page 51 of the 2009 Tyson Foods annual report below. You can navigate through the pages in the report by either clicking on the pages listed below, or by using the keyword search tool below to find specific information within the annual report.-
 1
1 -
2
-
3
-
4
-
5
-
6
-
7
-
8
-
9
-
10
-
11
-
12
-
13
-
14
-
15
-
16
-
17
-
18
-
19
-
20
-
21
-
22
-
23
-
24
-
25
-
26
-
27
-
28
-
29
-
30
-
31
-
32
-
33
-
34
-
35
-
36
-
37
-
38
-
39
-
40
-
 41
41 -
 42
42 -
 43
43 -
 44
44 -
 45
45 -
 46
46 -
 47
47 -
 48
48 -
 49
49 -
 50
50 -
 51
51 -
 52
52 -
 53
53 -
 54
54 -
 55
55 -
 56
56 -
 57
57 -
 58
58 -
 59
59 -
 60
60 -
 61
61 -
62
-
63
-
64
-
65
-
66
-
67
-
68
-
69
-
70
-
71
-
72
-
73
-
74
-
75
-
76
-
77
-
78
-
79
-
80
-
81
-
82
-
83
-
84
-
85
-
86
-
87
-
88
-
89
-
90
-
91
-
92
 |
 |

51
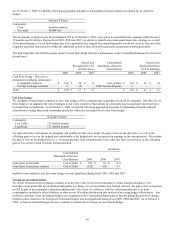
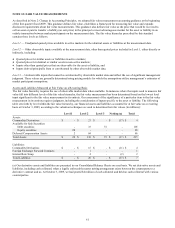
Included in our undesignated positions are certain commodity grain positions (which do not qualify for hedge treatment) we enter into
to manage the risk of costs associated with forward sales to certain customers for which sales prices are determined under cost-plus
arrangements. These unrealized positions totaled losses of $17 million and $24 million at October 3, 2009, and September 27, 2008,
respectively. When these positions are liquidated, we expect any realized gains or losses will be reflected in the prices of the poultry
products sold. Since these derivative positions do not qualify for hedge treatment, they initially create volatility in our earnings
associated with changes in fair value. However, once the positions are liquidated and included in the sales price to the customer, there
is ultimately no earnings impact as any previous fair value gains or losses are included in the prices of the poultry products.
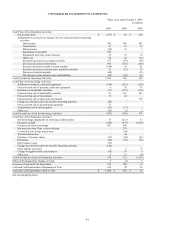
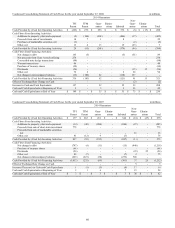
The following table sets forth the pretax impact of the undesignated derivative instruments on the Consolidated Statements of Income
(in millions):
Consolidated
Gain/(Loss)
Statements of Income
Recognized
Classification
in Earnings
2009
2008
2007
Derivatives not designated
as hedging instruments:
Commodity contracts
Sales
$
(34
)
$
(12
)
$
14
Commodity contracts
Cost of Sales
(151
)
259
40
Foreign exchange contracts
Other Income/Expense
-
1
1
Interest rate contracts
Interest Expense
(4
)
-
-
Total
$
(189
)
$
248
$
55
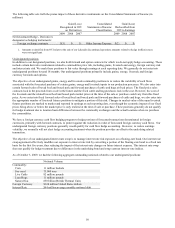
The following table sets forth the fair value of all derivative instruments outstanding in the Consolidated Balance Sheets (in millions):
Fair Value
Balance Sheet
Classification
2009
2008
Derivative Assets:
Derivatives designated as hedging instruments:
Commodity contracts
Other current assets
$
12
$
29
Derivatives not designated as hedging instruments:
Commodity contracts
Other current assets
9
-
Total derivative assets
$
21
$
29
Derivative Liabilities:
Derivatives designated as hedging instruments:
Commodity contracts
Other current liabilities
$
2
$
34
Foreign exchange contracts
Other current liabilities
-
2
Total derivative liabilities – designated
2
36
Derivatives not designated as hedging instruments:
Commodity contracts
Other current liabilities
13
7
Foreign exchange contracts
Other current liabilities
1
2
Interest rate contracts
Other current liabilities
4
-
Total derivative liabilities – not designated
18
9
Total derivative liabilities
$
20
$
45
1.
Beginning in fiscal 2009, our derivative assets and liabilities are presented in our Consolidated Balance Sheets on a net basis. We net
derivative assets and liabilities, including cash collateral when a legally enforceable master netting arrangement exists between the
counterparty to a derivative contract and us. See Note 12: Fair Value Measurements for a reconciliation to amounts reported in the
Consolidated Balance Sheet. We did not restate fiscal 2008 balances as the impact was not material.