Time Magazine 2013 Annual Report Download - page 63
Download and view the complete annual report
Please find page 63 of the 2013 Time Magazine annual report below. You can navigate through the pages in the report by either clicking on the pages listed below, or by using the keyword search tool below to find specific information within the annual report.-
 1
1 -
2
-
3
-
4
-
5
-
6
-
7
-
8
-
9
-
10
-
11
-
12
-
13
-
14
-
15
-
16
-
17
-
18
-
19
-
20
-
21
-
22
-
23
-
24
-
25
-
26
-
27
-
28
-
29
-
30
-
31
-
32
-
33
-
34
-
35
-
36
-
37
-
38
-
39
-
40
-
41
-
42
-
43
-
44
-
45
-
46
-
47
-
48
-
49
-
50
-
51
-
52
-
 53
53 -
 54
54 -
 55
55 -
 56
56 -
 57
57 -
 58
58 -
 59
59 -
 60
60 -
 61
61 -
 62
62 -
 63
63 -
 64
64 -
 65
65 -
 66
66 -
 67
67 -
 68
68 -
 69
69 -
 70
70 -
 71
71 -
 72
72 -
 73
73 -
74
-
75
-
76
-
77
-
78
-
79
-
80
-
81
-
82
-
83
-
84
-
85
-
86
-
87
-
88
-
89
-
90
-
91
-
92
-
93
-
94
-
95
-
96
-
97
-
98
-
99
-
100
-
101
-
102
-
103
-
104
-
105
-
106
-
107
-
108
-
109
-
110
-
111
-
112
-
113
-
114
-
115
-
116
-
117
-
118
-
119
-
120
-
121
-
122
-
123
-
124
-
125
-
126
-
127
-
128
-
129
-
130
-
131
-
132
-
133
-
134
-
135
-
136
-
137
-
138
-
139
-
140
-
141
-
142
-
143
-
144
-
145
-
146
 |
 |

TIME WARNER INC.
MANAGEMENT’S DISCUSSION AND ANALYSIS
OF RESULTS OF OPERATIONS AND FINANCIAL CONDITION – (Continued)
higher Operating Income were largely offset by higher net income taxes paid and higher net interest payments
related to higher average net debt in 2012.
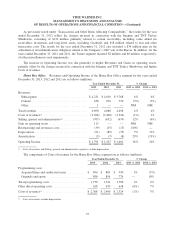
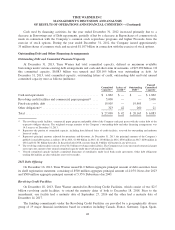
Investing Activities
Details of Cash used by investing activities are as follows (millions):
Year Ended December 31,
2013 2012 2011
Investments in available-for-sale securities ..................... $ (27) $ (37) $ (34)
Investments and acquisitions, net of cash acquired:
CME................................................. (288) (171) (61)
Bleacher Report ........................................ — (170) —
All other .............................................. (197) (327) (304)
Capital expenditures ...................................... (602) (643) (772)
All other investment and sale proceeds ........................ 204 102 85
Cash used by investing activities ............................. $ (910) $ (1,246) $ (1,086)
Cash used by investing activities for the year ended December 31, 2013 decreased primarily due to lower
investments and acquisitions spending and higher other investment and sale proceeds, including the sale of the
Company’s investment in a theater joint venture in Japan.
Cash used by investing activities for the year ended December 31, 2012 increased primarily due to higher
investments and acquisitions spending, partially offset by a decrease in capital expenditures.
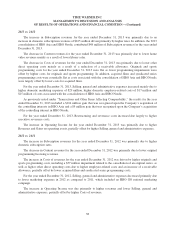
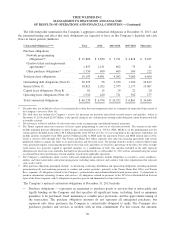
Financing Activities
Details of Cash used by financing activities are as follows (millions):
Year Ended December 31,
2013 2012 2011
Borrowings ............................................ $ 1,028 $ 1,039 $ 3,037
Debt repayments ........................................ (762) (686) (80)
Proceeds from the exercise of stock options .................. 674 1,107 204
Excess tax benefit from equity instruments ................... 179 83 22
Principal payments on capital leases ........................ (9) (11) (12)
Repurchases of common stock ............................. (3,708) (3,272) (4,611)
Dividends paid ......................................... (1,074) (1,011) (997)
Other financing activities ................................. (111) (80) (96)
Cash used by financing activities ........................... $ (3,783) $ (2,831) $ (2,533)
Cash used by financing activities for the year ended December 31, 2013 increased primarily due to higher
Repurchases of common stock and lower Proceeds from the exercise of stock options. During the year ended
December 31, 2013, the Company issued approximately 20 million shares of common stock and received $674
million in connection with the exercise of stock options. At December 31, 2013, all of the approximately
27 million exercisable stock options outstanding on such date had exercise prices below the closing price of the
Company’s common stock on the New York Stock Exchange.
47