Time Magazine 2013 Annual Report Download - page 48
Download and view the complete annual report
Please find page 48 of the 2013 Time Magazine annual report below. You can navigate through the pages in the report by either clicking on the pages listed below, or by using the keyword search tool below to find specific information within the annual report.-
 1
1 -
2
-
3
-
4
-
5
-
6
-
7
-
8
-
9
-
10
-
11
-
12
-
13
-
14
-
15
-
16
-
17
-
18
-
19
-
20
-
21
-
22
-
23
-
24
-
25
-
26
-
27
-
28
-
29
-
30
-
31
-
32
-
33
-
34
-
35
-
36
-
37
-
 38
38 -
 39
39 -
 40
40 -
 41
41 -
 42
42 -
 43
43 -
 44
44 -
 45
45 -
 46
46 -
 47
47 -
 48
48 -
 49
49 -
 50
50 -
 51
51 -
 52
52 -
 53
53 -
 54
54 -
 55
55 -
 56
56 -
 57
57 -
 58
58 -
59
-
60
-
61
-
62
-
63
-
64
-
65
-
66
-
67
-
68
-
69
-
70
-
71
-
72
-
73
-
74
-
75
-
76
-
77
-
78
-
79
-
80
-
81
-
82
-
83
-
84
-
85
-
86
-
87
-
88
-
89
-
90
-
91
-
92
-
93
-
94
-
95
-
96
-
97
-
98
-
99
-
100
-
101
-
102
-
103
-
104
-
105
-
106
-
107
-
108
-
109
-
110
-
111
-
112
-
113
-
114
-
115
-
116
-
117
-
118
-
119
-
120
-
121
-
122
-
123
-
124
-
125
-
126
-
127
-
128
-
129
-
130
-
131
-
132
-
133
-
134
-
135
-
136
-
137
-
138
-
139
-
140
-
141
-
142
-
143
-
144
-
145
-
146
 |
 |

TIME WARNER INC.
MANAGEMENT’S DISCUSSION AND ANALYSIS
OF RESULTS OF OPERATIONS AND FINANCIAL CONDITION – (Continued)
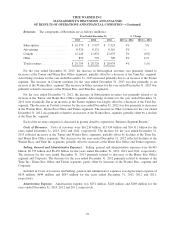
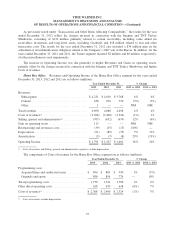
Revenues. The components of Revenues are as follows (millions):
Year Ended December 31, % Change
2013 2012 2011 2013 vs. 2012 2012 vs. 2011
Subscription .................. $ 10,379 $ 9,997 $ 9,523 4% 5%
Advertising ................... 6,326 6,121 6,116 3% —
Content ...................... 12,240 11,832 12,635 3% (6%)
Other ........................ 850 779 700 9% 11%
Total revenues ................. $ 29,795 $ 28,729 $ 28,974 4% (1%)
For the year ended December 31, 2013, the increase in Subscription revenues was primarily related to
increases at the Turner and Home Box Office segments, partially offset by a decrease at the Time Inc. segment.
Advertising revenues for the year ended December 31, 2013 increased primarily due to an increase at the Turner
segment. The increase in Content revenues for the year ended December 31, 2013 was due primarily to an
increase at the Warner Bros. segment. The increase in Other revenues for the year ended December 31, 2013 was
primarily related to increases at the Warner Bros. and Time Inc. segments.
For the year ended December 31, 2012, the increase in Subscription revenues was primarily related to an
increase at the Turner and Home Box Office segments. Advertising revenues for the year ended December 31,
2012 were essentially flat as an increase at the Turner segment was largely offset by a decrease at the Time Inc.
segment. The decrease in Content revenues for the year ended December 31, 2012 was due primarily to decreases
at the Warner Bros., Home Box Office and Turner segments. The increase in Other revenues for the year ended
December 31, 2012 was primarily related to an increase at the Warner Bros. segment, partially offset by a decline
at the Time Inc. segment.
Each of the revenue categories is discussed in greater detail by segment in “Business Segment Results.”
Costs of Revenues. Costs of revenues were $16.230 billion, $15.934 billion and $16.311 billion for the
years ended December 31, 2013, 2012 and 2011, respectively. The increase for the year ended December 31,
2013 reflected increases at the Turner and Warner Bros. segments, partially offset by declines at the Time Inc.
and Home Box Office segments. The decrease for the year ended December 31, 2012 reflected declines at the
Warner Bros. and Time Inc. segments, partially offset by increases at the Home Box Office and Turner segments.
Selling, General and Administrative Expenses. Selling, general and administrative expenses were $6.465
billion, $6.333 billion and $6.439 billion for the years ended December 31, 2013, 2012 and 2011, respectively.
The increase for the year ended December 31, 2013 primarily related to increases at the Home Box Office
segment and Corporate. The decrease for the year ended December 31, 2012 primarily related to declines at the
Time Inc., Home Box Office and Turner segments, partly offset by increases at the Warner Bros. segment and
Corporate.
Included in Costs of revenues and Selling, general and administrative expenses was depreciation expense of
$635 million, $644 million and $653 million for the years ended December 31, 2013, 2012 and 2011,
respectively.
Amortization Expense. Amortization expense was $251 million, $248 million and $269 million for the
years ended December 31, 2013, 2012 and 2011, respectively.
32