Time Magazine 2013 Annual Report Download - page 55
Download and view the complete annual report
Please find page 55 of the 2013 Time Magazine annual report below. You can navigate through the pages in the report by either clicking on the pages listed below, or by using the keyword search tool below to find specific information within the annual report.-
 1
1 -
2
-
3
-
4
-
5
-
6
-
7
-
8
-
9
-
10
-
11
-
12
-
13
-
14
-
15
-
16
-
17
-
18
-
19
-
20
-
21
-
22
-
23
-
24
-
25
-
26
-
27
-
28
-
29
-
30
-
31
-
32
-
33
-
34
-
35
-
36
-
37
-
38
-
39
-
40
-
41
-
42
-
43
-
44
-
 45
45 -
 46
46 -
 47
47 -
 48
48 -
 49
49 -
 50
50 -
 51
51 -
 52
52 -
 53
53 -
 54
54 -
 55
55 -
 56
56 -
 57
57 -
 58
58 -
 59
59 -
 60
60 -
 61
61 -
 62
62 -
 63
63 -
 64
64 -
 65
65 -
66
-
67
-
68
-
69
-
70
-
71
-
72
-
73
-
74
-
75
-
76
-
77
-
78
-
79
-
80
-
81
-
82
-
83
-
84
-
85
-
86
-
87
-
88
-
89
-
90
-
91
-
92
-
93
-
94
-
95
-
96
-
97
-
98
-
99
-
100
-
101
-
102
-
103
-
104
-
105
-
106
-
107
-
108
-
109
-
110
-
111
-
112
-
113
-
114
-
115
-
116
-
117
-
118
-
119
-
120
-
121
-
122
-
123
-
124
-
125
-
126
-
127
-
128
-
129
-
130
-
131
-
132
-
133
-
134
-
135
-
136
-
137
-
138
-
139
-
140
-
141
-
142
-
143
-
144
-
145
-
146
 |
 |

TIME WARNER INC.
MANAGEMENT’S DISCUSSION AND ANALYSIS
OF RESULTS OF OPERATIONS AND FINANCIAL CONDITION – (Continued)
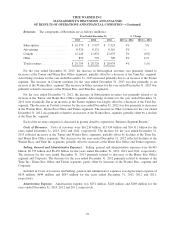
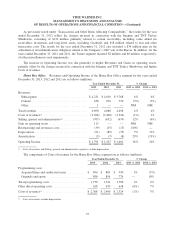
Warner Bros. Revenues and Operating Income of the Warner Bros. segment for the years ended
December 31, 2013, 2012 and 2011 are as follows (millions):
Year Ended December 31, % Change
2013 2012 2011 2013 vs. 2012 2012 vs. 2011
Revenues:
Subscription ................... $ 130 $ 117 $ 86 11% 36%
Advertising .................... 81 81 85 — (5%)
Content ....................... 11,764 11,522 12,274 2% (6%)
Other ......................... 337 298 193 13% 54%
Total revenues .................... 12,312 12,018 12,638 2% (5%)
Costs of revenues(a) ................ (8,674) (8,503) (9,081) 2% (6%)
Selling, general and administrative(a) . . . (1,885) (1,879) (1,857) — 1%
Gain on operating assets ............619NM (89%)
Asset impairments ................ (7) (4) (21) 75% (81%)
Restructuring and severance costs .... (49) (23) (41) 113% (44%)
Depreciation ..................... (200) (202) (198) (1%) 2%
Amortization ..................... (179) (180) (186) (1%) (3%)
Operating Income ................. $ 1,324 $ 1,228 $ 1,263 8% (3%)
(a) Costs of revenues and Selling, general and administrative expenses exclude depreciation.
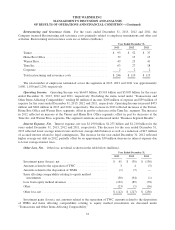
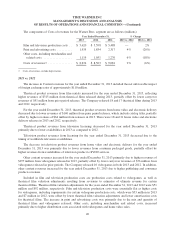
Content revenues primarily relate to theatrical product (which is content made available for initial exhibition
in theaters) and television product (which is content made available for initial airing on television). The
components of Content revenues for the years ended December 31, 2013, 2012 and 2011 are as follows
(millions):
Year Ended December 31, % Change
2013 2012 2011 2013 vs. 2012 2012 vs. 2011
Theatrical product:
Film rentals ................. $ 2,158 $ 1,894 $ 2,101 14% (10%)
Home video and electronic
delivery .................. 2,244 2,320 2,866 (3%) (19%)
Television licensing .......... 1,525 1,601 1,578 (5%) 1%
Consumer products and other . . . 190 208 164 (9%) 27%
Total theatrical product .......... 6,117 6,023 6,709 2% (10%)
Television product:
Television licensing .......... 3,364 3,433 3,371 (2%) 2%
Home video and electronic
delivery .................. 984 1,006 877 (2%) 15%
Consumer products and other . . . 263 299 246 (12%) 22%
Total television product ......... 4,611 4,738 4,494 (3%) 5%
Other ........................ 1,036 761 1,071 36% (29%)
Total Content revenues .......... $ 11,764 $ 11,522 $ 12,274 2% (6%)
39