Time Magazine 2013 Annual Report Download - page 61
Download and view the complete annual report
Please find page 61 of the 2013 Time Magazine annual report below. You can navigate through the pages in the report by either clicking on the pages listed below, or by using the keyword search tool below to find specific information within the annual report.-
 1
1 -
2
-
3
-
4
-
5
-
6
-
7
-
8
-
9
-
10
-
11
-
12
-
13
-
14
-
15
-
16
-
17
-
18
-
19
-
20
-
21
-
22
-
23
-
24
-
25
-
26
-
27
-
28
-
29
-
30
-
31
-
32
-
33
-
34
-
35
-
36
-
37
-
38
-
39
-
40
-
41
-
42
-
43
-
44
-
45
-
46
-
47
-
48
-
49
-
50
-
 51
51 -
 52
52 -
 53
53 -
 54
54 -
 55
55 -
 56
56 -
 57
57 -
 58
58 -
 59
59 -
 60
60 -
 61
61 -
 62
62 -
 63
63 -
 64
64 -
 65
65 -
 66
66 -
 67
67 -
 68
68 -
 69
69 -
 70
70 -
 71
71 -
72
-
73
-
74
-
75
-
76
-
77
-
78
-
79
-
80
-
81
-
82
-
83
-
84
-
85
-
86
-
87
-
88
-
89
-
90
-
91
-
92
-
93
-
94
-
95
-
96
-
97
-
98
-
99
-
100
-
101
-
102
-
103
-
104
-
105
-
106
-
107
-
108
-
109
-
110
-
111
-
112
-
113
-
114
-
115
-
116
-
117
-
118
-
119
-
120
-
121
-
122
-
123
-
124
-
125
-
126
-
127
-
128
-
129
-
130
-
131
-
132
-
133
-
134
-
135
-
136
-
137
-
138
-
139
-
140
-
141
-
142
-
143
-
144
-
145
-
146
 |
 |

TIME WARNER INC.
MANAGEMENT’S DISCUSSION AND ANALYSIS
OF RESULTS OF OPERATIONS AND FINANCIAL CONDITION – (Continued)
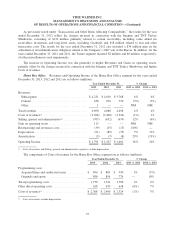
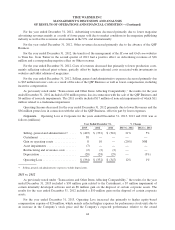
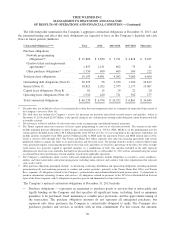
performance targets, higher external costs related to mergers, acquisitions or dispositions of $25 million related
to the separation of Time Inc. from Time Warner, higher compensation expense of $22 million and Asset
impairments of $7 million, partially offset by the $38 million gain related to the Curtailment.
Selling, general and administrative expenses included costs related to enterprise efficiency initiatives of $49
million and $48 million for the years ended December 31, 2013 and 2012, respectively. The enterprise efficiency
initiatives involve the centralization of certain administrative functions to generate cost savings or other benefits
for the Company.
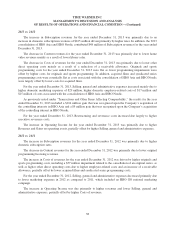
2012 vs. 2011
As previously noted under “Transactions and Other Items Affecting Comparability,” the results for the year
ended December 31, 2012 included a $10 million gain on the disposal of certain corporate assets.
For the year ended December 31, 2012, Operating Loss increased due primarily to higher costs related to
investments in enterprise efficiency initiatives, offset in part by a change in estimate associated with the
Company’s employee benefit plans of approximately $15 million.
For the years ended December 31, 2012 and 2011, Selling, general and administrative expenses included
$48 million and $20 million, respectively, of costs related to enterprise efficiency initiatives.
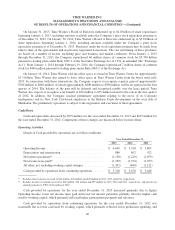
FINANCIAL CONDITION AND LIQUIDITY
Management believes that cash generated by or available to the Company should be sufficient to fund its
capital and liquidity needs for the foreseeable future, including scheduled debt repayments, quarterly dividend
payments and the purchase of common stock under the Company’s stock repurchase program. Time Warner’s
sources of cash include Cash provided by operations, Cash and equivalents on hand, available borrowing
capacity under its committed credit facilities and commercial paper program and access to capital markets. Time
Warner’s unused committed capacity at December 31, 2013 was $6.883 billion, which included $1.862 billion of
Cash and equivalents.
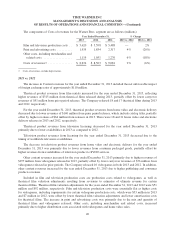
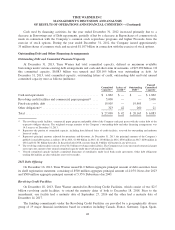
Current Financial Condition
At December 31, 2013, Time Warner had net debt of $18.303 billion ($20.165 billion of debt less $1.862
billion of Cash and equivalents) and $29.904 billion of Shareholders’ equity, compared to net debt of $17.030
billion ($19.871 billion of debt less $2.841 billion of Cash and equivalents) and $29.796 billion of Shareholders’
equity at December 31, 2012.
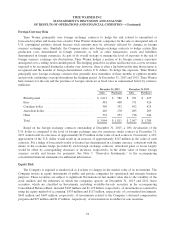
The following table shows the significant items contributing to the increase in net debt from December 31,
2012 to December 31, 2013 (millions):
Balance at December 31, 2012 ................................................. $ 17,030
Cash provided by operations .................................................. (3,714)
Capital expenditures ......................................................... 602
Repurchases of common stock ................................................. 3,708
Dividends paid to common stockholders ......................................... 1,074
Investments and acquisitions, net of cash acquired ................................. 512
Proceeds from the exercise of stock options ...................................... (674)
Investment and sale proceeds .................................................. (204)
All other, net ............................................................... (31)
Balance at December 31, 2013 ................................................. $ 18,303
45