Time Magazine 2013 Annual Report Download - page 57
Download and view the complete annual report
Please find page 57 of the 2013 Time Magazine annual report below. You can navigate through the pages in the report by either clicking on the pages listed below, or by using the keyword search tool below to find specific information within the annual report.-
 1
1 -
2
-
3
-
4
-
5
-
6
-
7
-
8
-
9
-
10
-
11
-
12
-
13
-
14
-
15
-
16
-
17
-
18
-
19
-
20
-
21
-
22
-
23
-
24
-
25
-
26
-
27
-
28
-
29
-
30
-
31
-
32
-
33
-
34
-
35
-
36
-
37
-
38
-
39
-
40
-
41
-
42
-
43
-
44
-
45
-
46
-
 47
47 -
 48
48 -
 49
49 -
 50
50 -
 51
51 -
 52
52 -
 53
53 -
 54
54 -
 55
55 -
 56
56 -
 57
57 -
 58
58 -
 59
59 -
 60
60 -
 61
61 -
 62
62 -
 63
63 -
 64
64 -
 65
65 -
 66
66 -
 67
67 -
68
-
69
-
70
-
71
-
72
-
73
-
74
-
75
-
76
-
77
-
78
-
79
-
80
-
81
-
82
-
83
-
84
-
85
-
86
-
87
-
88
-
89
-
90
-
91
-
92
-
93
-
94
-
95
-
96
-
97
-
98
-
99
-
100
-
101
-
102
-
103
-
104
-
105
-
106
-
107
-
108
-
109
-
110
-
111
-
112
-
113
-
114
-
115
-
116
-
117
-
118
-
119
-
120
-
121
-
122
-
123
-
124
-
125
-
126
-
127
-
128
-
129
-
130
-
131
-
132
-
133
-
134
-
135
-
136
-
137
-
138
-
139
-
140
-
141
-
142
-
143
-
144
-
145
-
146
 |
 |
TIME WARNER INC.
MANAGEMENT’S DISCUSSION AND ANALYSIS
OF RESULTS OF OPERATIONS AND FINANCIAL CONDITION – (Continued)
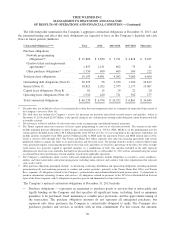
As previously noted under “Transactions and Other Items Affecting Comparability,” the results for year
ended December 31, 2013 included $6 million of miscellaneous gains on operating assets and $7 million of
miscellaneous asset impairments.
The increase in Restructuring and severance costs for the year ended December 31, 2013 was primarily
related to executive severance costs.
The increase in Operating Income for the year ended December 31, 2013 was primarily due to higher
Revenues, partially offset by higher Costs of revenues and higher Restructuring and severance costs.
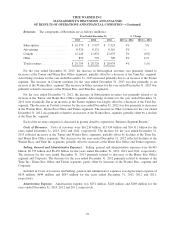
2012 vs. 2011
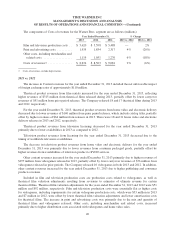
The decrease in Content revenues for the year ended December 31, 2012 included the net unfavorable impact
of foreign exchange rates of approximately $160 million.
Theatrical product revenues from film rentals decreased for the year ended December 31, 2012 reflecting
lower revenues from theatrical films released in 2012 of $267 million, partially offset by higher carryover
revenues from prior period releases of $60 million. The Company released 17 and 22 theatrical films during 2012
and 2011, respectively.
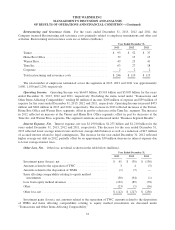
For the year ended December 31, 2012, theatrical product revenues from home video and electronic delivery
decreased due to lower revenues from releases in 2012 of $464 million and lower revenues of $82 million from
prior period releases, including catalog. There were 21 and 20 home video and electronic delivery releases in
2012 and 2011, respectively.
Television product revenues from licensing for the year ended December 31, 2012 increased due to higher
revenues from initial telecasts of $177 million, mainly reflecting higher fees for certain returning series as well as
the timing of network deliveries, partially offset by lower worldwide syndication revenues mainly as a result of
the initial off-network availability of The Big Bang Theory in 2011.
The increase in television product revenues from home video and electronic delivery for the year ended
December 31, 2012 was primarily related to higher electronic delivery revenues reflecting new SVOD
agreements and higher EST sales.
The increase in television product revenues from consumer products and other for the year ended
December 31, 2012 was primarily due to higher retransmission royalties received.
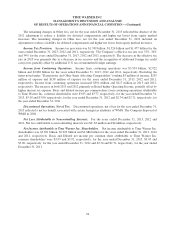
Other content revenues decreased for the year ended December 31, 2012 primarily due to lower revenues
from videogames released in 2012 of $548 million, partially offset by higher revenues from videogame releases
in prior periods of $203 million and higher third party distribution revenues of $49 million. The Company
released 10 and 13 videogames in 2012 and 2011, respectively.
The increase in Other revenues for the year ended December 31, 2012 primarily reflected higher revenues
from the Warner Bros. Studio Tour London – The Making of Harry Potter and higher international television
production activities for third parties.
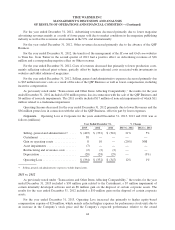
For the year ended December 31, 2012, print and advertising costs declined mainly due to fewer theatrical
film releases. The increase in film and television production costs for the year ended December 31, 2012 was
mainly due to the mix of product released. Included in film and television production costs are theatrical film
valuation adjustments resulting from revisions to estimates of ultimate revenue for certain theatrical films.
Theatrical film valuation adjustments for the years ended December 31, 2012 and 2011 were $92 million and $74
million, respectively. Other costs, including merchandise and related costs, decreased for the year ended
December 31, 2012 primarily due to lower distribution costs, associated with lower theatrical home video and
videogame sales.
41