Time Magazine 2013 Annual Report Download - page 10
Download and view the complete annual report
Please find page 10 of the 2013 Time Magazine annual report below. You can navigate through the pages in the report by either clicking on the pages listed below, or by using the keyword search tool below to find specific information within the annual report.-
 1
1 -
 2
2 -
 3
3 -
 4
4 -
 5
5 -
 6
6 -
 7
7 -
 8
8 -
 9
9 -
 10
10 -
 11
11 -
 12
12 -
 13
13 -
 14
14 -
 15
15 -
 16
16 -
 17
17 -
 18
18 -
 19
19 -
 20
20 -
 21
21 -
22
-
23
-
24
-
25
-
26
-
27
-
28
-
29
-
30
-
31
-
32
-
33
-
34
-
35
-
36
-
37
-
38
-
39
-
40
-
41
-
42
-
43
-
44
-
45
-
46
-
47
-
48
-
49
-
50
-
51
-
52
-
53
-
54
-
55
-
56
-
57
-
58
-
59
-
60
-
61
-
62
-
63
-
64
-
65
-
66
-
67
-
68
-
69
-
70
-
71
-
72
-
73
-
74
-
75
-
76
-
77
-
78
-
79
-
80
-
81
-
82
-
83
-
84
-
85
-
86
-
87
-
88
-
89
-
90
-
91
-
92
-
93
-
94
-
95
-
96
-
97
-
98
-
99
-
100
-
101
-
102
-
103
-
104
-
105
-
106
-
107
-
108
-
109
-
110
-
111
-
112
-
113
-
114
-
115
-
116
-
117
-
118
-
119
-
120
-
121
-
122
-
123
-
124
-
125
-
126
-
127
-
128
-
129
-
130
-
131
-
132
-
133
-
134
-
135
-
136
-
137
-
138
-
139
-
140
-
141
-
142
-
143
-
144
-
145
-
146
 |
 |

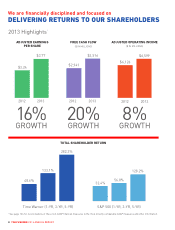
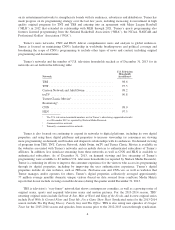
We are financially disciplined and focused on
DELIVERING RETURNS TO OUR SHAREHOLDERS
$3.24
$3.77
20132012
16%
GROWTH
$6,126
$6,599
20132012
8%
GROWTH
ADJUSTED EARNINGS
PER SHARE
ADJUSTED OPERATING INCOME
($ IN MILLIONS)
2013 Highlights1
$2,941
$3,516
20132012
20%
GROWTH
FREE CASH FLOW
($ IN MILLIONS)
48.6%
133.1%
282.3%
32.4% 56.8%
128.2%
TOTAL SHAREHOLDER RETURN
Time Warner (1-YR, 3-YR, 5-YR) S&P 500 (1-YR, 3-YR, 5-YR)
8 TIME WARNER 2013 ANNUAL REPORT
1 See page 124 for reconciliations of these non-GAAP financial measures to the most directly comparable GAAP measures and other information.