Time Magazine 2013 Annual Report Download - page 58
Download and view the complete annual report
Please find page 58 of the 2013 Time Magazine annual report below. You can navigate through the pages in the report by either clicking on the pages listed below, or by using the keyword search tool below to find specific information within the annual report.-
 1
1 -
2
-
3
-
4
-
5
-
6
-
7
-
8
-
9
-
10
-
11
-
12
-
13
-
14
-
15
-
16
-
17
-
18
-
19
-
20
-
21
-
22
-
23
-
24
-
25
-
26
-
27
-
28
-
29
-
30
-
31
-
32
-
33
-
34
-
35
-
36
-
37
-
38
-
39
-
40
-
41
-
42
-
43
-
44
-
45
-
46
-
47
-
 48
48 -
 49
49 -
 50
50 -
 51
51 -
 52
52 -
 53
53 -
 54
54 -
 55
55 -
 56
56 -
 57
57 -
 58
58 -
 59
59 -
 60
60 -
 61
61 -
 62
62 -
 63
63 -
 64
64 -
 65
65 -
 66
66 -
 67
67 -
 68
68 -
69
-
70
-
71
-
72
-
73
-
74
-
75
-
76
-
77
-
78
-
79
-
80
-
81
-
82
-
83
-
84
-
85
-
86
-
87
-
88
-
89
-
90
-
91
-
92
-
93
-
94
-
95
-
96
-
97
-
98
-
99
-
100
-
101
-
102
-
103
-
104
-
105
-
106
-
107
-
108
-
109
-
110
-
111
-
112
-
113
-
114
-
115
-
116
-
117
-
118
-
119
-
120
-
121
-
122
-
123
-
124
-
125
-
126
-
127
-
128
-
129
-
130
-
131
-
132
-
133
-
134
-
135
-
136
-
137
-
138
-
139
-
140
-
141
-
142
-
143
-
144
-
145
-
146
 |
 |

TIME WARNER INC.
MANAGEMENT’S DISCUSSION AND ANALYSIS
OF RESULTS OF OPERATIONS AND FINANCIAL CONDITION – (Continued)
As previously noted under “Transactions and Other Items Affecting Comparability,” the 2012 results
included $4 million of noncash impairments. The 2011 results included $21 million of noncash impairments, of
which $12 million related to capitalized software costs. In addition, the 2011 results included $9 million of
noncash gains related to fair value adjustments on certain contingent consideration arrangements.
The decrease in Operating Income for the year ended December 31, 2012 was primarily due to lower
Revenues, partially offset by lower Costs of revenues.
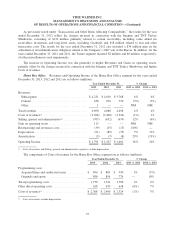
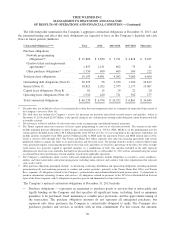
Time Inc. Revenues and Operating Income of the Time Inc. segment for the years ended December 31,
2013, 2012 and 2011 are as follows (millions):
Year Ended December 31, % Change
2013 2012 2011 2013 vs. 2012 2012 vs. 2011
Revenues:
Subscription .................... $1,129 $ 1,210 $ 1,271 (7%) (5%)
Advertising ..................... 1,807 1,819 1,923 (1%) (5%)
Content ........................ 86 91 84 (5%) 8%
Other .......................... 332 316 399 5% (21%)
Total revenues ..................... 3,354 3,436 3,677 (2%) (7%)
Costs of revenues(a) ................. (1,289) (1,364) (1,400) (5%) (3%)
Selling, general and administrative(a) . . . (1,472) (1,456) (1,537) 1% (5%)
Gain (loss) on operating assets ........ 13 (36) — NM NM
Asset impairments ................. (79) (6) (17) NM (65%)
Restructuring and severance costs ..... (63) (27) (18) 133% 50%
Depreciation ...................... (85) (91) (100) (7%) (9%)
Amortization ...................... (42) (36) (42) 17% (14%)
Operating Income .................. $ 337 $ 420 $ 563 (20%) (25%)
(a) Costs of revenues and Selling, general and administrative expenses exclude depreciation.
The components of Costs of revenues for the Time Inc. segment are as follows (millions):
Year Ended December 31, % Change
2013 2012 2011 2013 vs. 2012 2012 vs. 2011
Production costs .................. $ 746 $ 795 $ 848 (6%) (6%)
Editorial costs .................... 443 487 474 (9%) 3%
Other ........................... 100 82 78 22% 5%
Costs of revenues(a) ................ $ 1,289 $ 1,364 $ 1,400 (5%) (3%)
(a) Costs of revenues exclude depreciation.
2013 vs. 2012
For the year ended December 31, 2013, Subscription revenues decreased primarily due to lower newsstand
revenues of $58 million and lower domestic subscription revenues of $25 million, both of which were mainly due
to market conditions in the magazine publishing industry. Included in Subscription revenues for the year ended
December 31, 2013 was $15 million of revenues resulting from the AEP Acquisition.
42