Time Magazine 2013 Annual Report Download - page 53
Download and view the complete annual report
Please find page 53 of the 2013 Time Magazine annual report below. You can navigate through the pages in the report by either clicking on the pages listed below, or by using the keyword search tool below to find specific information within the annual report.-
 1
1 -
2
-
3
-
4
-
5
-
6
-
7
-
8
-
9
-
10
-
11
-
12
-
13
-
14
-
15
-
16
-
17
-
18
-
19
-
20
-
21
-
22
-
23
-
24
-
25
-
26
-
27
-
28
-
29
-
30
-
31
-
32
-
33
-
34
-
35
-
36
-
37
-
38
-
39
-
40
-
41
-
42
-
 43
43 -
 44
44 -
 45
45 -
 46
46 -
 47
47 -
 48
48 -
 49
49 -
 50
50 -
 51
51 -
 52
52 -
 53
53 -
 54
54 -
 55
55 -
 56
56 -
 57
57 -
 58
58 -
 59
59 -
 60
60 -
 61
61 -
 62
62 -
 63
63 -
64
-
65
-
66
-
67
-
68
-
69
-
70
-
71
-
72
-
73
-
74
-
75
-
76
-
77
-
78
-
79
-
80
-
81
-
82
-
83
-
84
-
85
-
86
-
87
-
88
-
89
-
90
-
91
-
92
-
93
-
94
-
95
-
96
-
97
-
98
-
99
-
100
-
101
-
102
-
103
-
104
-
105
-
106
-
107
-
108
-
109
-
110
-
111
-
112
-
113
-
114
-
115
-
116
-
117
-
118
-
119
-
120
-
121
-
122
-
123
-
124
-
125
-
126
-
127
-
128
-
129
-
130
-
131
-
132
-
133
-
134
-
135
-
136
-
137
-
138
-
139
-
140
-
141
-
142
-
143
-
144
-
145
-
146
 |
 |

TIME WARNER INC.
MANAGEMENT’S DISCUSSION AND ANALYSIS
OF RESULTS OF OPERATIONS AND FINANCIAL CONDITION – (Continued)
As previously noted under “Transactions and Other Items Affecting Comparability,” the results for the year
ended December 31, 2012 reflect the charges incurred in connection with the Imagine and TNT Turkey
Shutdowns, consisting of $174 million primarily related to certain receivables, including value added tax
receivables, inventories and long-lived assets, including Goodwill, and $18 million related to exit and other
transaction costs. The results for the year ended December 31, 2012 also included a $34 million gain on the
settlement of an indemnification obligation related to the Company’s 2007 sale of the Braves. In addition, for the
years ended December 31, 2012 and 2011, the Turner segment incurred $2 million and $6 million, respectively,
of other miscellaneous asset impairments.
The increase in Operating Income was due primarily to higher Revenues and Gains on operating assets,
partially offset by the charges incurred in connection with the Imagine and TNT Turkey Shutdowns and higher
Costs of revenues.
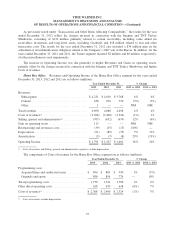
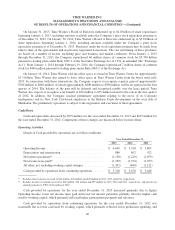
Home Box Office. Revenues and Operating Income of the Home Box Office segment for the years ended
December 31, 2013, 2012 and 2011 are as follows (millions):
Year Ended December 31, % Change
2013 2012 2011 2013 vs. 2012 2012 vs. 2011
Revenues:
Subscription ................................ $4,231 $ 4,010 $ 3,768 6% 6%
Content .................................... 658 676 730 (3%) (7%)
Other ...................................... 1 — — NM NM
Total revenues ................................ 4,890 4,686 4,498 4% 4%
Costs of revenues(a) ............................ (2,368) (2,400) (2,324) (1%) 3%
Selling, general and administrative(a) ............... (705) (632) (674) 12% (6%)
Gain on operating assets ......................... 113 — — NM NM
Restructuring and severance costs ................. (39) (15) (15) 160% —
Depreciation .................................. (91) (85) (75) 7% 13%
Amortization ................................. (9) (7) (8) 29% (13%)
Operating Income .............................. $1,791 $ 1,547 $ 1,402 16% 10%
(a) Costs of revenues and Selling, general and administrative expenses exclude depreciation.
The components of Costs of revenues for the Home Box Office segment are as follows (millions):
Year Ended December 31, % Change
2013 2012 2011 2013 vs. 2012 2012 vs. 2011
Programming costs:
Acquired films and syndicated series ............ $ 894 $ 885 $ 930 1% (5%)
Originals and sports ......................... 856 856 776 — 10%
Total programming costs ....................... 1,750 1,741 1,706 1% 2%
Other direct operating costs ..................... 618 659 618 (6%) 7%
Costs of revenues(a) ........................... $ 2,368 $ 2,400 $ 2,324 (1%) 3%
(a) Costs of revenues exclude depreciation.
37