Time Magazine 2013 Annual Report Download - page 60
Download and view the complete annual report
Please find page 60 of the 2013 Time Magazine annual report below. You can navigate through the pages in the report by either clicking on the pages listed below, or by using the keyword search tool below to find specific information within the annual report.-
 1
1 -
2
-
3
-
4
-
5
-
6
-
7
-
8
-
9
-
10
-
11
-
12
-
13
-
14
-
15
-
16
-
17
-
18
-
19
-
20
-
21
-
22
-
23
-
24
-
25
-
26
-
27
-
28
-
29
-
30
-
31
-
32
-
33
-
34
-
35
-
36
-
37
-
38
-
39
-
40
-
41
-
42
-
43
-
44
-
45
-
46
-
47
-
48
-
49
-
 50
50 -
 51
51 -
 52
52 -
 53
53 -
 54
54 -
 55
55 -
 56
56 -
 57
57 -
 58
58 -
 59
59 -
 60
60 -
 61
61 -
 62
62 -
 63
63 -
 64
64 -
 65
65 -
 66
66 -
 67
67 -
 68
68 -
 69
69 -
 70
70 -
71
-
72
-
73
-
74
-
75
-
76
-
77
-
78
-
79
-
80
-
81
-
82
-
83
-
84
-
85
-
86
-
87
-
88
-
89
-
90
-
91
-
92
-
93
-
94
-
95
-
96
-
97
-
98
-
99
-
100
-
101
-
102
-
103
-
104
-
105
-
106
-
107
-
108
-
109
-
110
-
111
-
112
-
113
-
114
-
115
-
116
-
117
-
118
-
119
-
120
-
121
-
122
-
123
-
124
-
125
-
126
-
127
-
128
-
129
-
130
-
131
-
132
-
133
-
134
-
135
-
136
-
137
-
138
-
139
-
140
-
141
-
142
-
143
-
144
-
145
-
146
 |
 |

TIME WARNER INC.
MANAGEMENT’S DISCUSSION AND ANALYSIS
OF RESULTS OF OPERATIONS AND FINANCIAL CONDITION – (Continued)
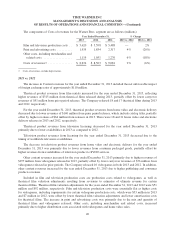
For the year ended December 31, 2012, Advertising revenues decreased primarily due to lower magazine
advertising revenues mainly as a result of fewer pages sold due to market conditions in the magazine publishing
industry as well as the economic environment in the U.S. and internationally.
For the year ended December 31, 2012, Other revenues decreased primarily due to the absence of the QSP
Business.
For the year ended December 31, 2012, the transfer of the management of the SI.com and Golf.com websites
to Time Inc. from Turner in the second quarter of 2012 had a positive effect on Advertising revenues of $26
million and a corresponding negative effect on Other revenues.
For the year ended December 31, 2012, Costs of revenues decreased due primarily to lower production costs,
mainly reflecting reduced print volume, partially offset by higher editorial costs associated with investments in
websites and tablet editions of magazines.
For the year ended December 31, 2012, Selling, general and administrative expenses decreased primarily due
to $65 million in lower costs as a result of the sale of the QSP Business as well as lower compensation, including
incentive compensation.
As previously noted under “Transactions and Other Items Affecting Comparability,” the results for the year
ended December 31, 2012 included a $36 million pretax loss in connection with the sale of the QSP Business and
$6 million of noncash impairments. The 2011 results included $17 million of noncash impairments of which $11
million related to a tradename impairment.
Operating Income decreased for the year ended December 31, 2012 primarily due to lower Revenues and the
$36 million pretax loss in connection with the sale of the QSP Business, offset in part by lower expenses.
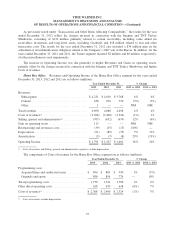
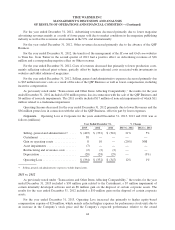
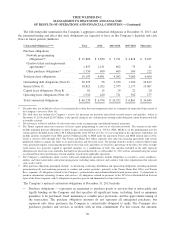
Corporate. Operating Loss at Corporate for the years ended December 31, 2013, 2012 and 2011 was as
follows (millions):
Year Ended December 31, % Change
2013 2012 2011 2013 vs. 2012 2012 vs. 2011
Selling, general and administrative(a) .... $ (403) $ (332) $ (316) 21% 5%
Curtailment ........................ 38 — — — —
Gain on operating assets .............. 8 10 — (20%) NM
Asset impairments ................... (7) — — — —
Restructuring and severance costs ....... (2) (2) (2) — —
Depreciation ........................ (28) (28) (29) — (3%)
Operating Loss ...................... $ (394) $ (352) $ (347) 12% 1%
(a) Selling, general and administrative expenses exclude depreciation.
2013 vs. 2012
As previously noted under “Transactions and Other Items Affecting Comparability,” the results for the year
ended December 31, 2013 included a $38 million gain related to the Curtailment, a $7 million impairment of
certain internally developed software and an $8 million gain on the disposal of certain corporate assets. The
results for the year ended December 31, 2012 included a $10 million gain on the disposal of certain corporate
assets.
For the year ended December 31, 2013, Operating Loss increased due primarily to higher equity-based
compensation expense of $26 million, which mainly reflected higher expenses for performance stock units due to
an increase in the Company’s stock price and the Company’s expected performance relative to the award
44