Time Magazine 2013 Annual Report Download - page 123
Download and view the complete annual report
Please find page 123 of the 2013 Time Magazine annual report below. You can navigate through the pages in the report by either clicking on the pages listed below, or by using the keyword search tool below to find specific information within the annual report.-
 1
1 -
2
-
3
-
4
-
5
-
6
-
7
-
8
-
9
-
10
-
11
-
12
-
13
-
14
-
15
-
16
-
17
-
18
-
19
-
20
-
21
-
22
-
23
-
24
-
25
-
26
-
27
-
28
-
29
-
30
-
31
-
32
-
33
-
34
-
35
-
36
-
37
-
38
-
39
-
40
-
41
-
42
-
43
-
44
-
45
-
46
-
47
-
48
-
49
-
50
-
51
-
52
-
53
-
54
-
55
-
56
-
57
-
58
-
59
-
60
-
61
-
62
-
63
-
64
-
65
-
66
-
67
-
68
-
69
-
70
-
71
-
72
-
73
-
74
-
75
-
76
-
77
-
78
-
79
-
80
-
81
-
82
-
83
-
84
-
85
-
86
-
87
-
88
-
89
-
90
-
91
-
92
-
93
-
94
-
95
-
96
-
97
-
98
-
99
-
100
-
101
-
102
-
103
-
104
-
105
-
106
-
107
-
108
-
109
-
110
-
111
-
112
-
 113
113 -
 114
114 -
 115
115 -
 116
116 -
 117
117 -
 118
118 -
 119
119 -
 120
120 -
 121
121 -
 122
122 -
 123
123 -
 124
124 -
 125
125 -
 126
126 -
 127
127 -
 128
128 -
 129
129 -
 130
130 -
 131
131 -
 132
132 -
 133
133 -
134
-
135
-
136
-
137
-
138
-
139
-
140
-
141
-
142
-
143
-
144
-
145
-
146
 |
 |

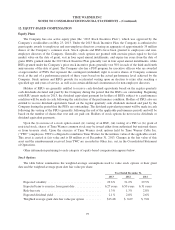
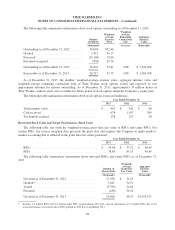
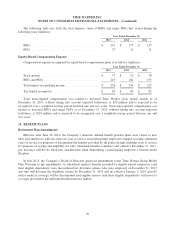
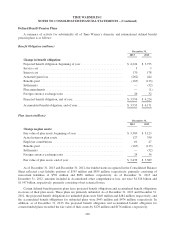
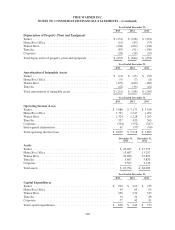
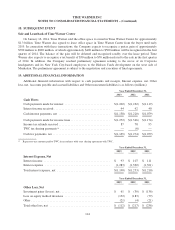
TIME WARNER INC.
NOTES TO CONSOLIDATED FINANCIAL STATEMENTS – (Continued)
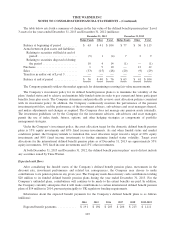
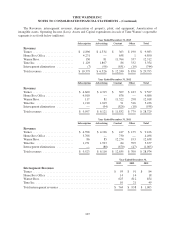
The Revenues, intersegment revenues, depreciation of property, plant, and equipment, Amortization of
intangible assets, Operating Income (Loss), Assets and Capital expenditures in each of Time Warner’s reportable
segments is set forth below (millions):
Year Ended December 31, 2013
Subscription Advertising Content Other Total
Revenues
Turner ........................... $ 4,896 $ 4,534 $ 363 $ 190 $ 9,983
Home Box Office .................. 4,231 — 658 1 4,890
Warner Bros. ..................... 130 81 11,764 337 12,312
Time Inc. ........................ 1,129 1,807 86 332 3,354
Intersegment eliminations ........... (7) (96) (631) (10) (744)
Total revenues .................... $ 10,379 $ 6,326 $ 12,240 $ 850 $ 29,795
Year Ended December 31, 2012
Subscription Advertising Content Other Total
Revenues
Turner ........................... $ 4,660 $ 4,315 $ 369 $ 183 $ 9,527
Home Box Office .................. 4,010 — 676 — 4,686
Warner Bros. ..................... 117 81 11,522 298 12,018
Time Inc. ........................ 1,210 1,819 91 316 3,436
Intersegment eliminations ........... — (94) (826) (18) (938)
Total revenues .................... $ 9,997 $ 6,121 $ 11,832 $ 779 $ 28,729
Year Ended December 31, 2011
Subscription Advertising Content Other Total
Revenues
Turner ........................... $ 4,398 $ 4,196 $ 417 $ 155 $ 9,166
Home Box Office .................. 3,768 — 730 — 4,498
Warner Bros. ..................... 86 85 12,274 193 12,638
Time Inc. ........................ 1,271 1,923 84 399 3,677
Intersegment eliminations ........... — (88) (870) (47) (1,005)
Total revenues .................... $ 9,523 $ 6,116 $ 12,635 $ 700 $ 28,974
Year Ended December 31,
2013 2012 2011
Intersegment Revenues
Turner ................................................... $ 95 $ 91 $ 84
Home Box Office .......................................... 14 14 18
Warner Bros. .............................................. 625 812 854
Time Inc. ................................................. 10 21 49
Total intersegment revenues .................................. $ 744 $ 938 $ 1,005
107