Time Magazine 2013 Annual Report Download - page 49
Download and view the complete annual report
Please find page 49 of the 2013 Time Magazine annual report below. You can navigate through the pages in the report by either clicking on the pages listed below, or by using the keyword search tool below to find specific information within the annual report.-
 1
1 -
2
-
3
-
4
-
5
-
6
-
7
-
8
-
9
-
10
-
11
-
12
-
13
-
14
-
15
-
16
-
17
-
18
-
19
-
20
-
21
-
22
-
23
-
24
-
25
-
26
-
27
-
28
-
29
-
30
-
31
-
32
-
33
-
34
-
35
-
36
-
37
-
38
-
 39
39 -
 40
40 -
 41
41 -
 42
42 -
 43
43 -
 44
44 -
 45
45 -
 46
46 -
 47
47 -
 48
48 -
 49
49 -
 50
50 -
 51
51 -
 52
52 -
 53
53 -
 54
54 -
 55
55 -
 56
56 -
 57
57 -
 58
58 -
 59
59 -
60
-
61
-
62
-
63
-
64
-
65
-
66
-
67
-
68
-
69
-
70
-
71
-
72
-
73
-
74
-
75
-
76
-
77
-
78
-
79
-
80
-
81
-
82
-
83
-
84
-
85
-
86
-
87
-
88
-
89
-
90
-
91
-
92
-
93
-
94
-
95
-
96
-
97
-
98
-
99
-
100
-
101
-
102
-
103
-
104
-
105
-
106
-
107
-
108
-
109
-
110
-
111
-
112
-
113
-
114
-
115
-
116
-
117
-
118
-
119
-
120
-
121
-
122
-
123
-
124
-
125
-
126
-
127
-
128
-
129
-
130
-
131
-
132
-
133
-
134
-
135
-
136
-
137
-
138
-
139
-
140
-
141
-
142
-
143
-
144
-
145
-
146
 |
 |

TIME WARNER INC.
MANAGEMENT’S DISCUSSION AND ANALYSIS
OF RESULTS OF OPERATIONS AND FINANCIAL CONDITION – (Continued)
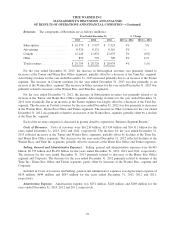
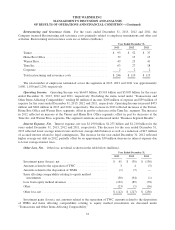
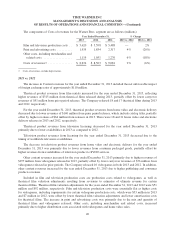
Restructuring and Severance Costs. For the years ended December 31, 2013, 2012 and 2011, the
Company incurred Restructuring and severance costs primarily related to employee terminations and other exit
activities. Restructuring and severance costs are as follows (millions):
Year Ended December 31,
2013 2012 2011
Turner ................................................. $ 93 $ 52 $ 37
Home Box Office ........................................ 39 15 15
Warner Bros. ............................................ 49 23 41
Time Inc. ............................................... 63 27 18
Corporate .............................................. 2 2 2
Total restructuring and severance costs ....................... $ 246 $ 119 $ 113
The total number of employees terminated across the segments in 2013, 2012 and 2011 was approximately
1,600, 1,100 and 1,200, respectively.
Operating Income. Operating Income was $6.605 billion, $5.918 billion and $5.805 billion for the years
ended December 31, 2013, 2012 and 2011, respectively. Excluding the items noted under “Transactions and
Other Items Affecting Comparability” totaling $6 million of income, $208 million of expense and $59 million of
expense for the years ended December 31, 2013, 2012 and 2011, respectively, Operating Income increased $473
million and $262 million in 2013 and 2012, respectively. The increase in 2013 reflected increases at the Turner,
Home Box Office and Warner Bros. segments, offset in part by a decrease at the Time Inc. segment. The increase
in 2012 reflected an increase at the Turner and Home Box Office segments, offset in part by decreases at the
Time Inc. and Warner Bros. segments. The segment variations are discussed under “Business Segment Results.”
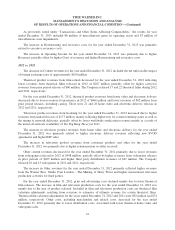
Interest Expense, Net. Interest expense, net was $1.190 billion, $1.253 billion and $1.210 billion for the
years ended December 31, 2013, 2012 and 2011, respectively. The decrease for the year ended December 31,
2013 reflected lower average interest rates and lower average debt balances as well as a reduction of $15 million
of accrued interest related to legal contingencies. The increase for the year ended December 31, 2012 reflected
higher average net debt in 2012, partially offset by an approximate $30 million decrease in interest expense due
to lower average interest rates.
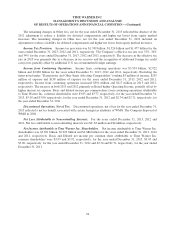
Other Loss, Net. Other loss, net detail is shown in the table below (millions):
Year Ended December 31,
2013 2012 2011
Investment gains (losses), net ............................... $ 61 $ (30) $ (136)
Amounts related to the separation of TWC .................... 3 4 (5)
Amounts related to the disposition of WMG ................... (1) (7) —
Items affecting comparability relating to equity method
investments ........................................... (30) (94) (1)
Loss from equity method investees .......................... (122) (89) (78)
Other .................................................. (23) (1) (16)
Other loss, net ........................................... $ (112) $ (217) $ (236)
Investment gains (losses), net, amounts related to the separation of TWC, amounts related to the disposition
of WMG and items affecting comparability relating to equity method investments are discussed under
“Transactions and Other Items Affecting Comparability.”
33