Time Magazine 2013 Annual Report Download - page 106
Download and view the complete annual report
Please find page 106 of the 2013 Time Magazine annual report below. You can navigate through the pages in the report by either clicking on the pages listed below, or by using the keyword search tool below to find specific information within the annual report.-
 1
1 -
2
-
3
-
4
-
5
-
6
-
7
-
8
-
9
-
10
-
11
-
12
-
13
-
14
-
15
-
16
-
17
-
18
-
19
-
20
-
21
-
22
-
23
-
24
-
25
-
26
-
27
-
28
-
29
-
30
-
31
-
32
-
33
-
34
-
35
-
36
-
37
-
38
-
39
-
40
-
41
-
42
-
43
-
44
-
45
-
46
-
47
-
48
-
49
-
50
-
51
-
52
-
53
-
54
-
55
-
56
-
57
-
58
-
59
-
60
-
61
-
62
-
63
-
64
-
65
-
66
-
67
-
68
-
69
-
70
-
71
-
72
-
73
-
74
-
75
-
76
-
77
-
78
-
79
-
80
-
81
-
82
-
83
-
84
-
85
-
86
-
87
-
88
-
89
-
90
-
91
-
92
-
93
-
94
-
95
-
 96
96 -
 97
97 -
 98
98 -
 99
99 -
 100
100 -
 101
101 -
 102
102 -
 103
103 -
 104
104 -
 105
105 -
 106
106 -
 107
107 -
 108
108 -
 109
109 -
 110
110 -
 111
111 -
 112
112 -
 113
113 -
 114
114 -
 115
115 -
 116
116 -
117
-
118
-
119
-
120
-
121
-
122
-
123
-
124
-
125
-
126
-
127
-
128
-
129
-
130
-
131
-
132
-
133
-
134
-
135
-
136
-
137
-
138
-
139
-
140
-
141
-
142
-
143
-
144
-
145
-
146
 |
 |

TIME WARNER INC.
NOTES TO CONSOLIDATED FINANCIAL STATEMENTS – (Continued)
respectively. Related accumulated amortization totaled $59 million and $49 million as of December 31, 2013 and
2012, respectively.
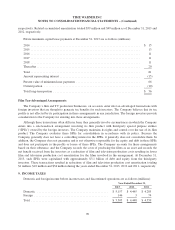
Future minimum capital lease payments at December 31, 2013 are as follows (millions):
2014 ........................................................................ $ 15
2015 ........................................................................ 13
2016 ........................................................................ 11
2017 ........................................................................ 11
2018 ........................................................................ 11
Thereafter .................................................................... 20
Total ........................................................................ 81
Amount representing interest ..................................................... (15)
Present value of minimum lease payments .......................................... 66
Current portion ............................................................... (10)
Total long-term portion ......................................................... $ 56
Film Tax-Advantaged Arrangements
The Company’s film and TV production businesses, on occasion, enter into tax-advantaged transactions with
foreign investors that are thought to generate tax benefits for such investors. The Company believes that its tax
profile is not affected by its participation in these arrangements in any jurisdiction. The foreign investors provide
consideration to the Company for entering into these arrangements.
Although these transactions often differ in form, they generally involve circumstances in which the Company
enters into a sale-leaseback arrangement involving its film product with third-party special purpose entities
(“SPEs”) owned by the foreign investors. The Company maintains its rights and control over the use of its film
product. The Company evaluates these SPEs for consolidation in accordance with its policy. Because the
Company generally does not have a controlling interest in the SPEs, it generally does not consolidate them. In
addition, the Company does not guarantee and is not otherwise responsible for the equity and debt in these SPEs
and does not participate in the profits or losses of these SPEs. The Company accounts for these arrangements
based on their substance, and the Company records the costs of producing the films as an asset and records the
net benefit received from the investors as a reduction of film and television production costs resulting in lower
film and television production cost amortization for the films involved in the arrangement. At December 31,
2013, such SPEs were capitalized with approximately $3.1 billion of debt and equity from the third-party
investors. These transactions resulted in reductions of film and television production cost amortization totaling
$1 million, $10 million and $34 million during the years ended December 31, 2013, 2012 and 2011, respectively.
9. INCOME TAXES
Domestic and foreign income before income taxes and discontinued operations are as follows (millions):
Year Ended December 31,
2013 2012 2011
Domestic ............................................... $ 5,157 $ 4,445 $ 4,285
Foreign ................................................. 146 3 74
Total ................................................... $ 5,303 $ 4,448 $ 4,359
90