Time Magazine 2013 Annual Report Download - page 51
Download and view the complete annual report
Please find page 51 of the 2013 Time Magazine annual report below. You can navigate through the pages in the report by either clicking on the pages listed below, or by using the keyword search tool below to find specific information within the annual report.-
 1
1 -
2
-
3
-
4
-
5
-
6
-
7
-
8
-
9
-
10
-
11
-
12
-
13
-
14
-
15
-
16
-
17
-
18
-
19
-
20
-
21
-
22
-
23
-
24
-
25
-
26
-
27
-
28
-
29
-
30
-
31
-
32
-
33
-
34
-
35
-
36
-
37
-
38
-
39
-
40
-
 41
41 -
 42
42 -
 43
43 -
 44
44 -
 45
45 -
 46
46 -
 47
47 -
 48
48 -
 49
49 -
 50
50 -
 51
51 -
 52
52 -
 53
53 -
 54
54 -
 55
55 -
 56
56 -
 57
57 -
 58
58 -
 59
59 -
 60
60 -
 61
61 -
62
-
63
-
64
-
65
-
66
-
67
-
68
-
69
-
70
-
71
-
72
-
73
-
74
-
75
-
76
-
77
-
78
-
79
-
80
-
81
-
82
-
83
-
84
-
85
-
86
-
87
-
88
-
89
-
90
-
91
-
92
-
93
-
94
-
95
-
96
-
97
-
98
-
99
-
100
-
101
-
102
-
103
-
104
-
105
-
106
-
107
-
108
-
109
-
110
-
111
-
112
-
113
-
114
-
115
-
116
-
117
-
118
-
119
-
120
-
121
-
122
-
123
-
124
-
125
-
126
-
127
-
128
-
129
-
130
-
131
-
132
-
133
-
134
-
135
-
136
-
137
-
138
-
139
-
140
-
141
-
142
-
143
-
144
-
145
-
146
 |
 |

TIME WARNER INC.
MANAGEMENT’S DISCUSSION AND ANALYSIS
OF RESULTS OF OPERATIONS AND FINANCIAL CONDITION – (Continued)
Business Segment Results
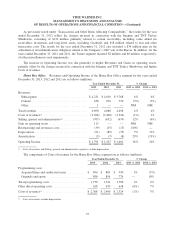
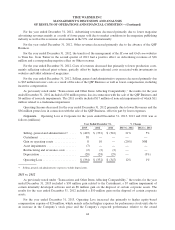
Turner. Revenues and Operating Income of the Turner segment for the years ended December 31, 2013,
2012 and 2011 are as follows (millions):
Year Ended December 31, % Change
2013 2012 2011 2013 vs. 2012 2012 vs. 2011
Revenues:
Subscription ................................ $4,896 $ 4,660 $ 4,398 5% 6%
Advertising ................................. 4,534 4,315 4,196 5% 3%
Content .................................... 363 369 417 (2%) (12%)
Other ...................................... 190 183 155 4% 18%
Total revenues ................................ 9,983 9,527 9,166 5% 4%
Costs of revenues(a) ............................ (4,382) (4,168) (4,082) 5% 2%
Selling, general and administrative(a) ............... (1,725) (1,730) (1,741) — (1%)
Gain (loss) on operating assets .................... 2 34 (2) (94%) NM
Asset impairments ............................. (47) (176) (6) (73%) NM
Restructuring and severance costs ................. (93) (52) (37) 79% 41%
Depreciation .................................. (231) (238) (251) (3%) (5%)
Amortization ................................. (21) (25) (33) (16%) (24%)
Operating Income .............................. $3,486 $ 3,172 $ 3,014 10% 5%
(a) Costs of revenues and Selling, general and administrative expenses exclude depreciation.
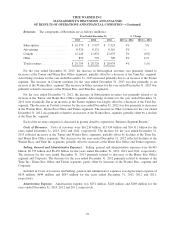
The components of Costs of revenues for the Turner segment are as follows (millions):
Year Ended December 31, % Change
2013 2012 2011 2013 vs. 2012 2012 vs. 2011
Programming costs:
Originals and sports ......................... $ 2,647 $ 2,498 $ 2,392 6% 4%
Acquired films and syndicated series ............ 946 890 906 6% (2%)
Total programming costs ....................... 3,593 3,388 3,298 6% 3%
Other direct operating costs ..................... 789 780 784 1% (1%)
Costs of revenues(a) ........................... $ 4,382 $ 4,168 $ 4,082 5% 2%
(a) Costs of revenues exclude depreciation.
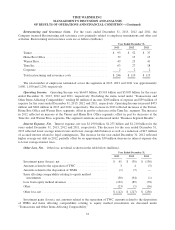
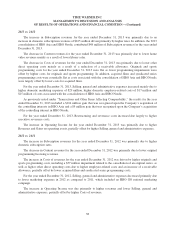
2013 vs. 2012
The increase in Subscription revenues for the year ended December 31, 2013 was primarily due to an
increase in domestic subscription revenues of $197 million driven primarily by higher domestic rates as well as
an increase in international subscription revenues of $39 million reflecting subscriber growth and the unfavorable
impact of foreign exchange rates of approximately $50 million.
The increase in Advertising revenues for the year ended December 31, 2013 reflected domestic growth of
$219 million driven by an increase at Turner’s domestic entertainment networks due to higher pricing and
demand, which included higher demand for sports programming, primarily the NBA and the National Collegiate
35