Time Magazine 2013 Annual Report Download - page 139
Download and view the complete annual report
Please find page 139 of the 2013 Time Magazine annual report below. You can navigate through the pages in the report by either clicking on the pages listed below, or by using the keyword search tool below to find specific information within the annual report.-
 1
1 -
2
-
3
-
4
-
5
-
6
-
7
-
8
-
9
-
10
-
11
-
12
-
13
-
14
-
15
-
16
-
17
-
18
-
19
-
20
-
21
-
22
-
23
-
24
-
25
-
26
-
27
-
28
-
29
-
30
-
31
-
32
-
33
-
34
-
35
-
36
-
37
-
38
-
39
-
40
-
41
-
42
-
43
-
44
-
45
-
46
-
47
-
48
-
49
-
50
-
51
-
52
-
53
-
54
-
55
-
56
-
57
-
58
-
59
-
60
-
61
-
62
-
63
-
64
-
65
-
66
-
67
-
68
-
69
-
70
-
71
-
72
-
73
-
74
-
75
-
76
-
77
-
78
-
79
-
80
-
81
-
82
-
83
-
84
-
85
-
86
-
87
-
88
-
89
-
90
-
91
-
92
-
93
-
94
-
95
-
96
-
97
-
98
-
99
-
100
-
101
-
102
-
103
-
104
-
105
-
106
-
107
-
108
-
109
-
110
-
111
-
112
-
113
-
114
-
115
-
116
-
117
-
118
-
119
-
120
-
121
-
122
-
123
-
124
-
125
-
126
-
127
-
128
-
 129
129 -
 130
130 -
 131
131 -
 132
132 -
 133
133 -
 134
134 -
 135
135 -
 136
136 -
 137
137 -
 138
138 -
 139
139 -
 140
140 -
 141
141 -
 142
142 -
 143
143 -
 144
144 -
 145
145 -
 146
146
 |
 |
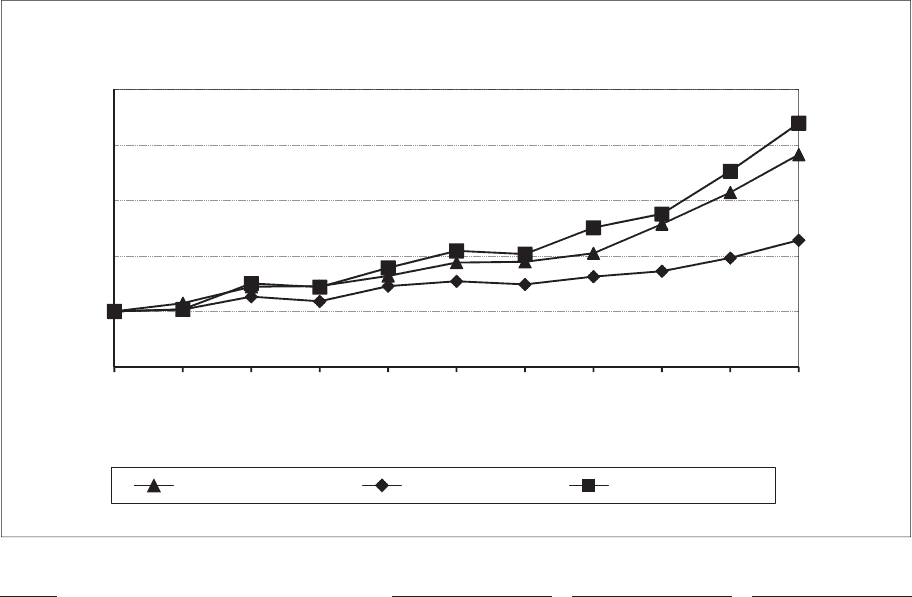
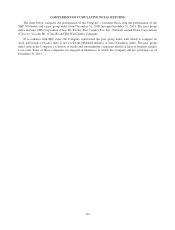
The chart assumes $100 was invested on December 31, 2008 in each of the Company’s Common Stock, the
S&P 500 Index and the peer group index and reflects the reinvestment of dividends and distributions on a
monthly basis and quarterly market capitalization weighting. The Company’s Common Stock performance has
been adjusted to take into account the separations of Time Warner Cable Inc. and AOL Inc. from the Company in
2009. From 2009 through 2013, the Company paid a quarterly dividend of (i) $0.1875 per share in 2009, (ii)
$0.2125 per share in 2010, (iii) $0.2350 in 2011, (iv) $0.2600 per share in 2012 and (v) $0.2875 per share in
2013. The per share dividend amounts above reflect adjustments for the 1-for-3 reverse stock split of the
Company’s Common Stock on March 27, 2009.
Comparison of Cumulative Total Returns
$0
Dec 08
Jun 09
Dec 09
Jun 10
Dec 10
Jun 11
Dec 11
Jun 12
Dec 12
Jun 13
Dec 13
$100
$200
$300
$400
$500
Time Warner Inc. S&P 500 Index Peer Group Index
Value at
Company
Common Stock S&P 500 Index
Peer Group
Index
December 31, 2008 ..................... $100 $100 $100
June 30, 2009 .......................... 115 103 104
December 31, 2009 ..................... 144 126 150
June 30, 2010 .......................... 145 118 144
December 31, 2010 ..................... 164 146 178
June 30, 2011 .......................... 188 154 209
December 31, 2011 ..................... 189 149 203
June 30, 2012 .......................... 205 163 251
December 31, 2012 ..................... 257 172 276
June 30, 2013 .......................... 314 196 352
December 31, 2013 ..................... 382 228 439
123