Time Magazine 2011 Annual Report Download - page 92
Download and view the complete annual report
Please find page 92 of the 2011 Time Magazine annual report below. You can navigate through the pages in the report by either clicking on the pages listed below, or by using the keyword search tool below to find specific information within the annual report.-
 1
1 -
2
-
3
-
4
-
5
-
6
-
7
-
8
-
9
-
10
-
11
-
12
-
13
-
14
-
15
-
16
-
17
-
18
-
19
-
20
-
21
-
22
-
23
-
24
-
25
-
26
-
27
-
28
-
29
-
30
-
31
-
32
-
33
-
34
-
35
-
36
-
37
-
38
-
39
-
40
-
41
-
42
-
43
-
44
-
45
-
46
-
47
-
48
-
49
-
50
-
51
-
52
-
53
-
54
-
55
-
56
-
57
-
58
-
59
-
60
-
61
-
62
-
63
-
64
-
65
-
66
-
67
-
68
-
69
-
70
-
71
-
72
-
73
-
74
-
75
-
76
-
77
-
78
-
79
-
80
-
81
-
 82
82 -
 83
83 -
 84
84 -
 85
85 -
 86
86 -
 87
87 -
 88
88 -
 89
89 -
 90
90 -
 91
91 -
 92
92 -
 93
93 -
 94
94 -
 95
95 -
 96
96 -
 97
97 -
 98
98 -
 99
99 -
 100
100 -
 101
101 -
 102
102 -
103
-
104
-
105
-
106
-
107
-
108
-
109
-
110
-
111
-
112
-
113
-
114
-
115
-
116
-
117
-
118
-
119
-
120
-
121
-
122
-
123
-
124
-
125
-
126
-
127
-
128
-
129
-
130
-
131
-
132
-
133
-
134
-
135
-
136
 |
 |

TIME WARNER INC.
NOTES TO CONSOLIDATED FINANCIAL STATEMENTS – (Continued)
Discontinued operations for the year ended December 31, 2009 included direct transaction costs (e.g., legal
and professional fees) related to the separations of TWC and AOL of $112 million. The Networks segment of
Time Warner recognized approximately $170 million of Subscription revenues from TWC in 2009 through the
Distribution Record Date.
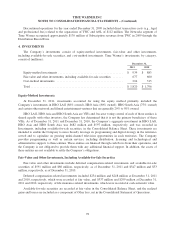
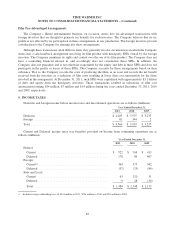
4. INVESTMENTS
The Company’s investments consist of equity-method investments, fair-value and other investments,
including available-for-sale securities, and cost-method investments. Time Warner’s investments, by category,
consist of (millions):
December 31,
2011 2010
Equity-method investments ........................................... $ 939 $ 883
Fair-value and other investments, including available-for-sale securities ....... 677 600
Cost-method investments ............................................ 204 313
Total ............................................................. $ 1,820 $ 1,796
Equity-Method Investments
At December 31, 2011, investments accounted for using the equity method primarily included the
Company’s investments in HBO LAG (88% owned), HBO Asia (80% owned), HBO South Asia (75% owned)
and certain other network and filmed entertainment ventures that are generally 20% to 50% owned.
HBO LAG, HBO Asia and HBO South Asia are VIEs and, because voting control of each of these entities is
shared equally with other investors, the Company has determined that it is not the primary beneficiary of these
VIEs. As of December 31, 2011 and December 31, 2010, the Company’s aggregate investment in HBO LAG,
HBO Asia and HBO South Asia was $682 million and $597 million, respectively, and was recorded in
Investments, including available-for-sale securities, in the Consolidated Balance Sheet. These investments are
intended to enable the Company to more broadly leverage its programming and digital strategy in the territories
served and to capitalize on growing multi-channel television opportunities in such territories. The Company
provides programming as well as certain services, including distribution, licensing and technological and
administrative support, to these entities. These entities are financed through cash flows from their operations, and
the Company is not obligated to provide them with any additional financial support. In addition, the assets of
these entities are not available to settle the Company’s obligations.
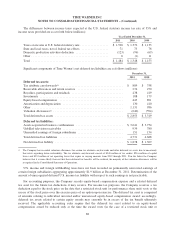
Fair-Value and Other Investments, Including Available-for-Sale Securities
Fair-value and other investments include deferred compensation-related investments and available-for-sale
securities of $591 million and $86 million, respectively, as of December 31, 2011 and $547 million and $53
million, respectively, as of December 31, 2010.
Deferred compensation-related investments included $254 million and $248 million at December 31, 2011
and 2010, respectively, which were recorded at fair value, and $337 million and $299 million at December 31,
2011 and 2010, respectively, of life insurance-related investments, which were recorded at cash surrender value.
Available-for-sale securities are recorded at fair value in the Consolidated Balance Sheet, and the realized
gains and losses are included as a component of Other loss, net in the Consolidated Statement of Operations.
78