Time Magazine 2011 Annual Report Download - page 45
Download and view the complete annual report
Please find page 45 of the 2011 Time Magazine annual report below. You can navigate through the pages in the report by either clicking on the pages listed below, or by using the keyword search tool below to find specific information within the annual report.-
 1
1 -
2
-
3
-
4
-
5
-
6
-
7
-
8
-
9
-
10
-
11
-
12
-
13
-
14
-
15
-
16
-
17
-
18
-
19
-
20
-
21
-
22
-
23
-
24
-
25
-
26
-
27
-
28
-
29
-
30
-
31
-
32
-
33
-
34
-
 35
35 -
 36
36 -
 37
37 -
 38
38 -
 39
39 -
 40
40 -
 41
41 -
 42
42 -
 43
43 -
 44
44 -
 45
45 -
 46
46 -
 47
47 -
 48
48 -
 49
49 -
 50
50 -
 51
51 -
 52
52 -
 53
53 -
 54
54 -
 55
55 -
56
-
57
-
58
-
59
-
60
-
61
-
62
-
63
-
64
-
65
-
66
-
67
-
68
-
69
-
70
-
71
-
72
-
73
-
74
-
75
-
76
-
77
-
78
-
79
-
80
-
81
-
82
-
83
-
84
-
85
-
86
-
87
-
88
-
89
-
90
-
91
-
92
-
93
-
94
-
95
-
96
-
97
-
98
-
99
-
100
-
101
-
102
-
103
-
104
-
105
-
106
-
107
-
108
-
109
-
110
-
111
-
112
-
113
-
114
-
115
-
116
-
117
-
118
-
119
-
120
-
121
-
122
-
123
-
124
-
125
-
126
-
127
-
128
-
129
-
130
-
131
-
132
-
133
-
134
-
135
-
136
 |
 |

TIME WARNER INC.
MANAGEMENT’S DISCUSSION AND ANALYSIS
OF RESULTS OF OPERATIONS AND FINANCIAL CONDITION – (Continued)
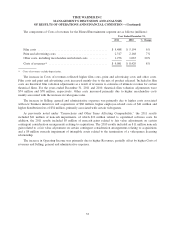
The increase in Costs of revenues was driven by higher programming costs and other direct operating costs.
The increase in programming costs reflected higher costs for originals and sports programming related primarily
to the NCAA Tournament and international growth. Approximately half of the increase in originals and sports
programming costs related to the NCAA Tournament. The increase in other direct operating costs was primarily
driven by higher international costs primarily related to international growth.
Selling, general and administrative expenses increased due primarily to higher marketing expenses of $63
million, which included expenses associated with an HBO GO national marketing campaign, and higher
international costs of $48 million, primarily associated with growth. In addition, for the year ended December 31,
2010, Selling, general and administrative expenses included a $58 million reserve reversal in connection with the
resolution of litigation related to the 2004 sale of the Winter Sports Teams.
As previously noted under “Transactions and Other Items Affecting Comparability,” the 2011 results
included $6 million of noncash impairments primarily related to a tradename impairment, and the 2010 results
included a $59 million Gain on operating assets that was recognized upon the Company’s acquisition of the
controlling interest in HBO CE, reflecting the excess of the fair value over the Company’s carrying costs of its
original investment in HBO CE.
Operating Income increased primarily due to higher revenues, partially offset by higher Costs of revenues,
Selling, general and administrative expenses and Restructuring and severance costs. Operating Income growth
for the year ended December 31, 2011 was also negatively affected due to the absence of the $59 million Gain on
operating assets relating to HBO CE discussed above.
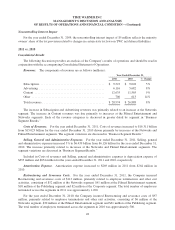
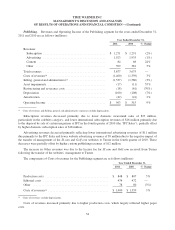
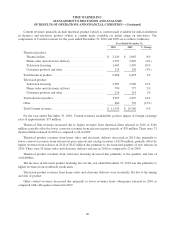
Filmed Entertainment. Revenues and Operating Income of the Filmed Entertainment segment for the
years ended December 31, 2011 and 2010 are as follows (millions):
Year Ended December 31,
2011 2010 % Change
Revenues:
Subscription ......................................... $ 86 $ 66 30%
Advertising ......................................... 85 75 13%
Content ............................................ 12,274 11,359 8%
Other .............................................. 193 122 58%
Total revenues ......................................... 12,638 11,622 9%
Costs of revenues(a) ...................................... (9,081) (8,429) 8%
Selling, general and administrative(a) ........................ (1,857) (1,684) 10%
Gain on operating assets ................................. 9 11 (18%)
Asset impairments ...................................... (21) (9) 133%
Restructuring and severance costs .......................... (41) (30) 37%
Depreciation .......................................... (198) (186) 6%
Amortization .......................................... (186) (188) (1%)
Operating Income ...................................... $ 1,263 $ 1,107 14%
(a) Costs of revenues and Selling, general and administrative expenses exclude depreciation.
31