Time Magazine 2011 Annual Report Download - page 43
Download and view the complete annual report
Please find page 43 of the 2011 Time Magazine annual report below. You can navigate through the pages in the report by either clicking on the pages listed below, or by using the keyword search tool below to find specific information within the annual report.-
 1
1 -
2
-
3
-
4
-
5
-
6
-
7
-
8
-
9
-
10
-
11
-
12
-
13
-
14
-
15
-
16
-
17
-
18
-
19
-
20
-
21
-
22
-
23
-
24
-
25
-
26
-
27
-
28
-
29
-
30
-
31
-
32
-
 33
33 -
 34
34 -
 35
35 -
 36
36 -
 37
37 -
 38
38 -
 39
39 -
 40
40 -
 41
41 -
 42
42 -
 43
43 -
 44
44 -
 45
45 -
 46
46 -
 47
47 -
 48
48 -
 49
49 -
 50
50 -
 51
51 -
 52
52 -
 53
53 -
54
-
55
-
56
-
57
-
58
-
59
-
60
-
61
-
62
-
63
-
64
-
65
-
66
-
67
-
68
-
69
-
70
-
71
-
72
-
73
-
74
-
75
-
76
-
77
-
78
-
79
-
80
-
81
-
82
-
83
-
84
-
85
-
86
-
87
-
88
-
89
-
90
-
91
-
92
-
93
-
94
-
95
-
96
-
97
-
98
-
99
-
100
-
101
-
102
-
103
-
104
-
105
-
106
-
107
-
108
-
109
-
110
-
111
-
112
-
113
-
114
-
115
-
116
-
117
-
118
-
119
-
120
-
121
-
122
-
123
-
124
-
125
-
126
-
127
-
128
-
129
-
130
-
131
-
132
-
133
-
134
-
135
-
136
 |
 |

TIME WARNER INC.
MANAGEMENT’S DISCUSSION AND ANALYSIS
OF RESULTS OF OPERATIONS AND FINANCIAL CONDITION – (Continued)
Operating Income. Operating Income increased to $5.805 billion in 2011 from $5.428 billion in 2010.
Excluding the items noted under “Transactions and Other Items Affecting Comparability” totaling $59 million of
expense and $28 million of income in 2011 and 2010, respectively, Operating Income increased $464 million,
reflecting increases at all of the segments. The segment variations are discussed under “Business Segment
Results.”
Interest Expense, Net. For the year ended December 31, 2011, Interest expense, net, increased to $1.210
billion from $1.178 billion for the year ended December 31, 2010. This increase reflected higher average debt in
2011, primarily related to the issuance of $2.0 billion aggregate principal amount of debt securities in April 2011
and $1.0 billion aggregate principal amount of debt securities in October 2011, partially offset by an approximate
$60 million decline in interest expense due to lower average interest rates.
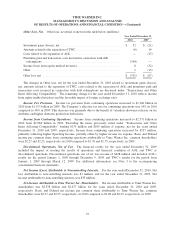
Other Loss, Net. Other loss, net detail is shown in the table below (millions):
Year Ended December 31,
2011 2010
Investment gains (losses), net ....................................... $ (168) $ 32
Amounts related to the separation of TWC ............................. (5) (6)
Premiums paid and transaction costs incurred in connection with debt
redemptions ................................................... — (364)
Income (loss) from equity method investees ............................ (40) 6
Other .......................................................... (16) 1
Other loss, net ................................................... $ (229) $ (331)
The changes in Other loss, net for the year ended December 31, 2011 related to investment gains (losses),
net, amounts related to the separation of TWC and premiums paid and transaction costs incurred in connection
with debt redemptions are discussed under “Transactions and Other Items Affecting Comparability.” For the year
ended December 31, 2011, the remaining change in Other loss, net was due primarily to losses from equity
method investees and the unfavorable impact of foreign exchange rates.
Income Tax Provision. Income tax provision increased to $1.484 billion in 2011 from $1.348 billion in
2010. The Company’s effective tax rate for continuing operations was 34% in both 2011 and 2010.
Net Income. Net income increased to $2.882 billion for the year ended December 31, 2011 from $2.571
billion for the year ended December 31, 2010. Excluding the items noted under “Transactions and Other Items
Affecting Comparability” totaling $189 million and $179 million of expense, net for the years ended
December 31, 2011 and 2010, respectively, Net income increased $321 million, primarily reflecting higher
Operating Income.
Net Loss Attributable to Noncontrolling Interests. For the years ended December 31, 2011 and 2010, Net
loss attributable to noncontrolling interests was $4 million and $7 million, respectively.
Net Income Attributable to Time Warner Inc. Shareholders. Net income attributable to Time Warner Inc.
shareholders was $2.886 billion and $2.578 billion for the years ended December 31, 2011 and 2010,
respectively. Basic and Diluted net income per common share attributable to Time Warner Inc. common
shareholders were $2.74 and $2.71, respectively, for the year ended December 31, 2011 compared to $2.27 and
$2.25, respectively, for the year ended December 31, 2010.
29