Time Magazine 2011 Annual Report Download - page 52
Download and view the complete annual report
Please find page 52 of the 2011 Time Magazine annual report below. You can navigate through the pages in the report by either clicking on the pages listed below, or by using the keyword search tool below to find specific information within the annual report.-
 1
1 -
2
-
3
-
4
-
5
-
6
-
7
-
8
-
9
-
10
-
11
-
12
-
13
-
14
-
15
-
16
-
17
-
18
-
19
-
20
-
21
-
22
-
23
-
24
-
25
-
26
-
27
-
28
-
29
-
30
-
31
-
32
-
33
-
34
-
35
-
36
-
37
-
38
-
39
-
40
-
41
-
 42
42 -
 43
43 -
 44
44 -
 45
45 -
 46
46 -
 47
47 -
 48
48 -
 49
49 -
 50
50 -
 51
51 -
 52
52 -
 53
53 -
 54
54 -
 55
55 -
 56
56 -
 57
57 -
 58
58 -
 59
59 -
 60
60 -
 61
61 -
 62
62 -
63
-
64
-
65
-
66
-
67
-
68
-
69
-
70
-
71
-
72
-
73
-
74
-
75
-
76
-
77
-
78
-
79
-
80
-
81
-
82
-
83
-
84
-
85
-
86
-
87
-
88
-
89
-
90
-
91
-
92
-
93
-
94
-
95
-
96
-
97
-
98
-
99
-
100
-
101
-
102
-
103
-
104
-
105
-
106
-
107
-
108
-
109
-
110
-
111
-
112
-
113
-
114
-
115
-
116
-
117
-
118
-
119
-
120
-
121
-
122
-
123
-
124
-
125
-
126
-
127
-
128
-
129
-
130
-
131
-
132
-
133
-
134
-
135
-
136
 |
 |

TIME WARNER INC.
MANAGEMENT’S DISCUSSION AND ANALYSIS
OF RESULTS OF OPERATIONS AND FINANCIAL CONDITION – (Continued)
Business Segment Results
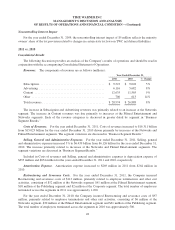
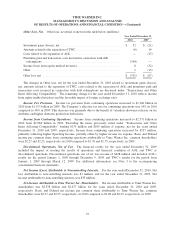
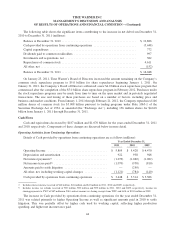
Networks. Revenues and Operating Income of the Networks segment for the years ended December 31,
2010 and 2009 are as follows (millions):
Year Ended December 31,
2010 2009 % Change
Revenues:
Subscription ......................................... $ 7,671 $ 7,077 8%
Advertising ......................................... 3,736 3,272 14%
Content ............................................ 942 819 15%
Other .............................................. 131 85 54%
Total revenues ......................................... 12,480 11,253 11%
Costs of revenues(a) ...................................... (5,732) (5,349) 7%
Selling, general and administrative(a) ........................ (2,200) (2,002) 10%
Gain on operating assets ................................. 59 — NM
Asset impairments ...................................... — (52) (100%)
Restructuring and severance costs .......................... (6) (8) (25%)
Depreciation .......................................... (342) (338) 1%
Amortization .......................................... (35) (34) 3%
Operating Income ...................................... $ 4,224 $ 3,470 22%
(a) Costs of revenues and Selling, general and administrative expenses exclude depreciation.
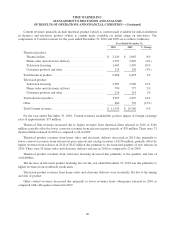
The increase in Subscription revenues consisted of an increase in domestic subscription revenues of
$406 million, mainly due to higher domestic subscription rates, and an increase in international subscription
revenues of $188 million, primarily due to the consolidation of HBO CE. Home Box Office’s domestic
subscribers declined by 1.6 million during 2010; however, as these subscribers generated very little or no
revenue, the decline had almost no impact on Subscription revenues.
The increase in Advertising revenues reflected domestic growth of $248 million at Turner mainly as a result
of strong pricing. Advertising revenues also increased $216 million due to international expansion and growth.
The increase in Content revenues was due primarily to higher sales of Home Box Office’s original
programming of $104 million and higher licensing revenues at Turner of $22 million, partially offset by a
decrease of approximately $20 million due to a larger benefit in 2009 associated with lower than anticipated
home video returns.
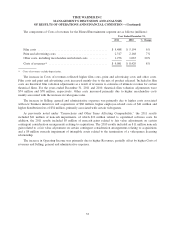
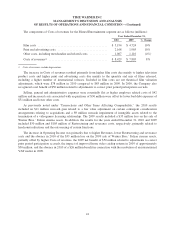
The components of Costs of revenues for the Networks segment are as follows (millions):
Year Ended December 31,
2010 2009 % Change
Programming costs:
Originals and sports .................................... $ 2,661 $ 2,316 15%
Acquired films and syndicated series ....................... 1,824 1,942 (6%)
Total programming costs .................................. 4,485 4,258 5%
Other direct operating costs ................................ 1,247 1,091 14%
Costs of revenues(a) ....................................... $ 5,732 $ 5,349 7%
(a) Costs of revenues exclude depreciation.
38