Time Magazine 2011 Annual Report Download - page 111
Download and view the complete annual report
Please find page 111 of the 2011 Time Magazine annual report below. You can navigate through the pages in the report by either clicking on the pages listed below, or by using the keyword search tool below to find specific information within the annual report.-
 1
1 -
2
-
3
-
4
-
5
-
6
-
7
-
8
-
9
-
10
-
11
-
12
-
13
-
14
-
15
-
16
-
17
-
18
-
19
-
20
-
21
-
22
-
23
-
24
-
25
-
26
-
27
-
28
-
29
-
30
-
31
-
32
-
33
-
34
-
35
-
36
-
37
-
38
-
39
-
40
-
41
-
42
-
43
-
44
-
45
-
46
-
47
-
48
-
49
-
50
-
51
-
52
-
53
-
54
-
55
-
56
-
57
-
58
-
59
-
60
-
61
-
62
-
63
-
64
-
65
-
66
-
67
-
68
-
69
-
70
-
71
-
72
-
73
-
74
-
75
-
76
-
77
-
78
-
79
-
80
-
81
-
82
-
83
-
84
-
85
-
86
-
87
-
88
-
89
-
90
-
91
-
92
-
93
-
94
-
95
-
96
-
97
-
98
-
99
-
100
-
 101
101 -
 102
102 -
 103
103 -
 104
104 -
 105
105 -
 106
106 -
 107
107 -
 108
108 -
 109
109 -
 110
110 -
 111
111 -
 112
112 -
 113
113 -
 114
114 -
 115
115 -
 116
116 -
 117
117 -
 118
118 -
 119
119 -
 120
120 -
 121
121 -
122
-
123
-
124
-
125
-
126
-
127
-
128
-
129
-
130
-
131
-
132
-
133
-
134
-
135
-
136
 |
 |

TIME WARNER INC.
NOTES TO CONSOLIDATED FINANCIAL STATEMENTS – (Continued)
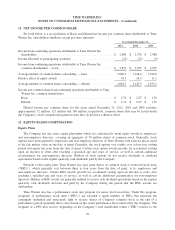
December 31, 2010, amounts included in Accumulated other comprehensive loss, net were $1.282 billion and
$992 million, respectively, primarily consisting of net actuarial losses.
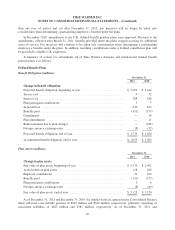
Certain defined benefit plans have projected benefit obligations and accumulated benefit obligations in
excess of their plan assets. These plans are primarily unfunded. As of December 31, 2011 and December 31,
2010, the projected benefit obligations in excess of plan assets for unfunded plans were $437 million and $411
million, respectively, and the accumulated benefit obligations in excess of plan assets for unfunded plans were
$429 million and $404 million, respectively. In addition, as of December 31, 2011, the projected benefit
obligation and accumulated benefit obligation for certain funded plans exceeded the fair value of their assets by
$220 million and $187 million, respectively.
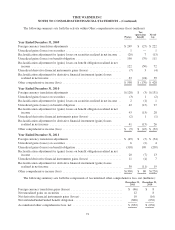
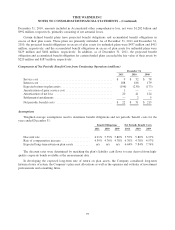
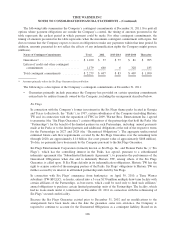
Components of Net Periodic Benefit Costs from Continuing Operations (millions)
December 31,
2011 2010 2009
Service cost ................................................ $ 9 $ 52 $ 78
Interest cost ................................................ 188 186 179
Expected return on plan assets .................................. (196) (230) (173)
Amortization of prior service cost ............................... 1 — —
Amortization of net loss ...................................... 20 41 124
Settlements/curtailments ...................................... — 2 5
Net periodic benefit costs ..................................... $ 22 $ 51 $ 213
Assumptions
Weighted-average assumptions used to determine benefit obligations and net periodic benefit costs for the
years ended December 31:
Benefit Obligations Net Periodic Benefit Costs
2011 2010 2009 2011 2010 2009
Discount rate ................................ 4.91% 5.55% 5.80% 5.55% 5.80% 6.17%
Rate of compensation increase ................... 4.39% 4.76% 4.78% 4.76% 4.78% 4.57%
Expected long-term return on plan assets .......... n/a n/a n/a 6.44% 7.84% 7.76%
The discount rates were determined by matching the plan’s liability cash flows to rates derived from high-
quality corporate bonds available at the measurement date.
In developing the expected long-term rate of return on plan assets, the Company considered long-term
historical rates of return, the Company’s plan asset allocations as well as the opinions and outlooks of investment
professionals and consulting firms.
97