Time Magazine 2011 Annual Report Download - page 50
Download and view the complete annual report
Please find page 50 of the 2011 Time Magazine annual report below. You can navigate through the pages in the report by either clicking on the pages listed below, or by using the keyword search tool below to find specific information within the annual report.-
 1
1 -
2
-
3
-
4
-
5
-
6
-
7
-
8
-
9
-
10
-
11
-
12
-
13
-
14
-
15
-
16
-
17
-
18
-
19
-
20
-
21
-
22
-
23
-
24
-
25
-
26
-
27
-
28
-
29
-
30
-
31
-
32
-
33
-
34
-
35
-
36
-
37
-
38
-
39
-
 40
40 -
 41
41 -
 42
42 -
 43
43 -
 44
44 -
 45
45 -
 46
46 -
 47
47 -
 48
48 -
 49
49 -
 50
50 -
 51
51 -
 52
52 -
 53
53 -
 54
54 -
 55
55 -
 56
56 -
 57
57 -
 58
58 -
 59
59 -
 60
60 -
61
-
62
-
63
-
64
-
65
-
66
-
67
-
68
-
69
-
70
-
71
-
72
-
73
-
74
-
75
-
76
-
77
-
78
-
79
-
80
-
81
-
82
-
83
-
84
-
85
-
86
-
87
-
88
-
89
-
90
-
91
-
92
-
93
-
94
-
95
-
96
-
97
-
98
-
99
-
100
-
101
-
102
-
103
-
104
-
105
-
106
-
107
-
108
-
109
-
110
-
111
-
112
-
113
-
114
-
115
-
116
-
117
-
118
-
119
-
120
-
121
-
122
-
123
-
124
-
125
-
126
-
127
-
128
-
129
-
130
-
131
-
132
-
133
-
134
-
135
-
136
 |
 |
TIME WARNER INC.
MANAGEMENT’S DISCUSSION AND ANALYSIS
OF RESULTS OF OPERATIONS AND FINANCIAL CONDITION – (Continued)
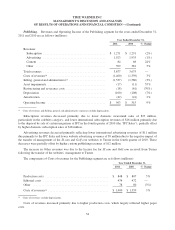
The increase in Subscription revenues for the year ended December 31, 2010 was primarily related to an
increase at the Networks segment. Advertising revenues increased for the year ended December 31, 2010
primarily reflecting growth at the Networks and Publishing segments. The increase in Content revenues for the
year ended December 31, 2010 was due primarily to increases at the Filmed Entertainment and Networks
segments.
Each of the revenue categories is discussed in greater detail by segment in “Business Segment Results.”
Costs of Revenues. For the years ended December 31, 2010 and 2009, Costs of revenues totaled
$15.023 billion and $14.235 billion, respectively. The segment variations are discussed in “Business Segment
Results.”
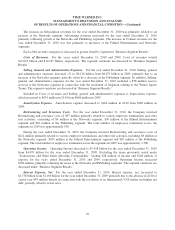
Selling, General and Administrative Expenses. For the year ended December 31, 2010, Selling, general
and administrative expenses increased 1% to $6.126 billion from $6.073 billion in 2009, primarily due to an
increase at the Networks segment, partially offset by a decrease at the Publishing segment. In addition, Selling,
general and administrative expenses for the year ended December 31, 2010 included a $58 million reserve
reversal at the Networks segment in connection with the resolution of litigation relating to the Winter Sports
Teams. The segment variations are discussed in “Business Segment Results.”
Included in Costs of revenues and Selling, general and administrative expenses is depreciation expense,
which increased to $674 million in 2010 from $668 million in 2009.
Amortization Expense. Amortization expense decreased to $264 million in 2010 from $280 million in
2009.
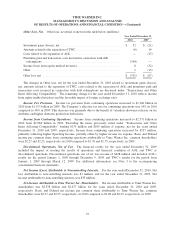
Restructuring and Severance Costs. For the year ended December 31, 2010, the Company incurred
Restructuring and severance costs of $97 million primarily related to various employee terminations and other
exit activities, consisting of $6 million at the Networks segment, $30 million at the Filmed Entertainment
segment and $61 million at the Publishing segment. The total number of employees terminated across the
segments in 2010 was approximately 500.
During the year ended December 31, 2009, the Company incurred Restructuring and severance costs of
$212 million primarily related to various employee terminations and other exit activities, including $8 million at
the Networks segment, $105 million at the Filmed Entertainment segment and $99 million at the Publishing
segment. The total number of employees terminated across the segments in 2009 was approximately 1,500.
Operating Income. Operating Income increased to $5.428 billion for the year ended December 31, 2010
from $4.470 billion for the year ended December 31, 2009. Excluding the items previously noted under
“Transactions and Other Items Affecting Comparability” totaling $28 million of income and $148 million of
expense for the years ended December 31, 2010 and 2009, respectively, Operating Income increased
$782 million, primarily reflecting increases at the Networks and Publishing segments. The segment variations are
discussed under “Business Segment Results.”
Interest Expense, Net. For the year ended December 31, 2010, Interest expense, net, increased to
$1.178 billion from $1.166 billion for the year ended December 31, 2009 primarily due to the absence in 2010 of
a prior year $43 million benefit in connection with the resolution of an international VAT matter and higher net
debt, partially offset by lower rates.
36