Time Magazine 2011 Annual Report Download - page 47
Download and view the complete annual report
Please find page 47 of the 2011 Time Magazine annual report below. You can navigate through the pages in the report by either clicking on the pages listed below, or by using the keyword search tool below to find specific information within the annual report.-
 1
1 -
2
-
3
-
4
-
5
-
6
-
7
-
8
-
9
-
10
-
11
-
12
-
13
-
14
-
15
-
16
-
17
-
18
-
19
-
20
-
21
-
22
-
23
-
24
-
25
-
26
-
27
-
28
-
29
-
30
-
31
-
32
-
33
-
34
-
35
-
36
-
 37
37 -
 38
38 -
 39
39 -
 40
40 -
 41
41 -
 42
42 -
 43
43 -
 44
44 -
 45
45 -
 46
46 -
 47
47 -
 48
48 -
 49
49 -
 50
50 -
 51
51 -
 52
52 -
 53
53 -
 54
54 -
 55
55 -
 56
56 -
 57
57 -
58
-
59
-
60
-
61
-
62
-
63
-
64
-
65
-
66
-
67
-
68
-
69
-
70
-
71
-
72
-
73
-
74
-
75
-
76
-
77
-
78
-
79
-
80
-
81
-
82
-
83
-
84
-
85
-
86
-
87
-
88
-
89
-
90
-
91
-
92
-
93
-
94
-
95
-
96
-
97
-
98
-
99
-
100
-
101
-
102
-
103
-
104
-
105
-
106
-
107
-
108
-
109
-
110
-
111
-
112
-
113
-
114
-
115
-
116
-
117
-
118
-
119
-
120
-
121
-
122
-
123
-
124
-
125
-
126
-
127
-
128
-
129
-
130
-
131
-
132
-
133
-
134
-
135
-
136
 |
 |

TIME WARNER INC.
MANAGEMENT’S DISCUSSION AND ANALYSIS
OF RESULTS OF OPERATIONS AND FINANCIAL CONDITION – (Continued)
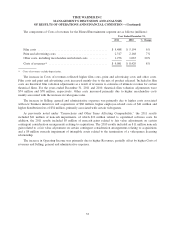
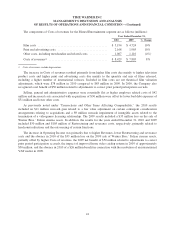
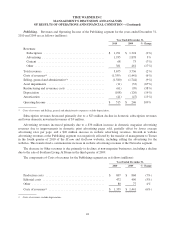
The components of Costs of revenues for the Filmed Entertainment segment are as follows (millions):
Year Ended December 31,
2011 2010 % Change
Film costs .............................................. $ 5,488 $ 5,194 6%
Print and advertising costs ................................. 2,317 2,168 7%
Other costs, including merchandise and related costs ............ 1,276 1,067 20%
Costs of revenues(a) ....................................... $ 9,081 $ 8,429 8%
(a) Costs of revenues exclude depreciation.
The increase in Costs of revenues reflected higher film costs, print and advertising costs and other costs.
Film costs and print and advertising costs increased mainly due to the mix of product released. Included in film
costs are theatrical film valuation adjustments as a result of revisions to estimates of ultimate revenue for certain
theatrical films. For the years ended December 31, 2011 and 2010, theatrical film valuation adjustments were
$74 million and $78 million, respectively. Other costs increased primarily due to higher merchandise costs
mainly associated with the increase in videogame sales.
The increase in Selling, general and administrative expenses was primarily due to higher costs associated
with new business initiatives and acquisitions of $60 million, higher employee-related costs of $41 million and
higher distribution fees of $34 million, primarily associated with certain videogames.
As previously noted under “Transactions and Other Items Affecting Comparability,” the 2011 results
included $21 million of noncash impairments, of which $12 million related to capitalized software costs. In
addition, the 2011 results included $9 million of noncash gains related to fair value adjustments on certain
contingent consideration arrangements relating to acquisitions. The 2010 results included an $11 million noncash
gain related to a fair value adjustment on certain contingent consideration arrangements relating to acquisitions
and a $9 million noncash impairment of intangible assets related to the termination of a videogames licensing
relationship.
The increase in Operating Income was primarily due to higher Revenues, partially offset by higher Costs of
revenues and Selling, general and administrative expenses.
33