Time Magazine 2011 Annual Report Download - page 57
Download and view the complete annual report
Please find page 57 of the 2011 Time Magazine annual report below. You can navigate through the pages in the report by either clicking on the pages listed below, or by using the keyword search tool below to find specific information within the annual report.-
 1
1 -
2
-
3
-
4
-
5
-
6
-
7
-
8
-
9
-
10
-
11
-
12
-
13
-
14
-
15
-
16
-
17
-
18
-
19
-
20
-
21
-
22
-
23
-
24
-
25
-
26
-
27
-
28
-
29
-
30
-
31
-
32
-
33
-
34
-
35
-
36
-
37
-
38
-
39
-
40
-
41
-
42
-
43
-
44
-
45
-
46
-
 47
47 -
 48
48 -
 49
49 -
 50
50 -
 51
51 -
 52
52 -
 53
53 -
 54
54 -
 55
55 -
 56
56 -
 57
57 -
 58
58 -
 59
59 -
 60
60 -
 61
61 -
 62
62 -
 63
63 -
 64
64 -
 65
65 -
 66
66 -
 67
67 -
68
-
69
-
70
-
71
-
72
-
73
-
74
-
75
-
76
-
77
-
78
-
79
-
80
-
81
-
82
-
83
-
84
-
85
-
86
-
87
-
88
-
89
-
90
-
91
-
92
-
93
-
94
-
95
-
96
-
97
-
98
-
99
-
100
-
101
-
102
-
103
-
104
-
105
-
106
-
107
-
108
-
109
-
110
-
111
-
112
-
113
-
114
-
115
-
116
-
117
-
118
-
119
-
120
-
121
-
122
-
123
-
124
-
125
-
126
-
127
-
128
-
129
-
130
-
131
-
132
-
133
-
134
-
135
-
136
 |
 |

TIME WARNER INC.
MANAGEMENT’S DISCUSSION AND ANALYSIS
OF RESULTS OF OPERATIONS AND FINANCIAL CONDITION – (Continued)
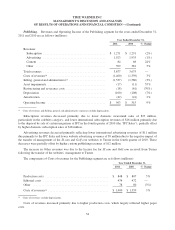
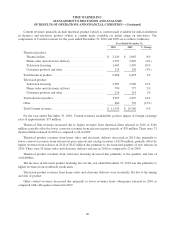
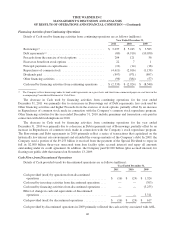
Production costs decreased primarily due to lower paper costs associated with a decline in paper prices.
Editorial costs decreased primarily as a result of cost savings initiatives.
Selling, general and administrative expenses decreased due primarily to lower marketing expenses of $93
million, in part due to cost savings initiatives, lower pension expenses of $92 million and the absence in 2010 of
an $18 million bad debt reserve in 2009 related to a newsstand wholesaler. These decreases were partly offset by
an increase in other general and administrative expenses.
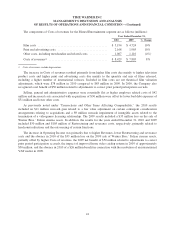
As previously noted under “Transactions and Other Items Affecting Comparability,” the 2010 results
included $11 million of noncash impairments related to certain intangible assets and the 2009 results included
$33 million of noncash impairments of certain fixed assets in connection with the Publishing segment’s
restructuring activities. In addition, the results for the years ended December 31, 2010 and 2009 included
Restructuring and severance costs of $61 million and $99 million, respectively.
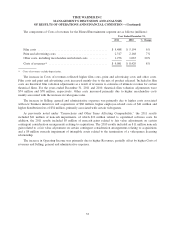
Operating Income increased due primarily to decreases in Selling, general and administrative expenses and
Costs of revenues, lower Restructuring and severance costs and a decrease in Asset impairments, partially offset
by lower Revenues.
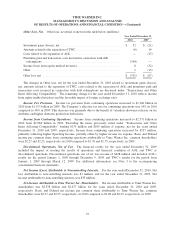
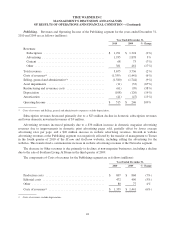
Corporate. Operating Loss of the Corporate segment for the years ended December 31, 2010 and 2009 is
as follows (millions):
Year Ended December 31,
2010 2009 % Change
Selling, general and administrative(a) ........................... $ (336) $ (325) 3%
Depreciation ............................................. (38) (40) (5%)
Operating Loss ............................................ $ (374) $ (365) 2%
(a) Selling, general and administrative expenses exclude depreciation.
Operating Loss was essentially flat compared to the prior year.
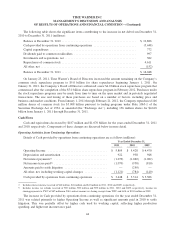
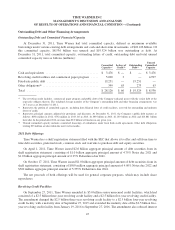
FINANCIAL CONDITION AND LIQUIDITY
Management believes that cash generated by or available to the Company should be sufficient to fund its
capital and liquidity needs for the foreseeable future, including quarterly dividend payments, the purchase of
common stock under the Company’s repurchase program and scheduled debt repayments. Time Warner’s
sources of cash include Cash provided by operations, Cash and equivalents on hand, available borrowing
capacity under its committed credit facilities and commercial paper program and access to capital markets. Time
Warner’s unused committed capacity at December 31, 2011 was $8.536 billion, which included $3.476 billion of
Cash and equivalents.
Current Financial Condition
At December 31, 2011, Time Warner had $19.524 billion of debt, $3.476 billion of Cash and equivalents (net
debt, defined as total debt less Cash and equivalents, of $16.048 billion) and $29.957 billion of Shareholders’
equity, compared to $16.549 billion of debt, $3.663 billion of Cash and equivalents (net debt of $12.886 billion)
and $32.940 billion of Shareholders’ equity at December 31, 2010.
43