Time Magazine 2011 Annual Report Download - page 46
Download and view the complete annual report
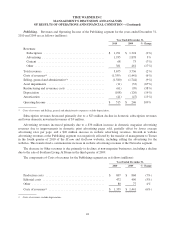
Please find page 46 of the 2011 Time Magazine annual report below. You can navigate through the pages in the report by either clicking on the pages listed below, or by using the keyword search tool below to find specific information within the annual report.-
 1
1 -
2
-
3
-
4
-
5
-
6
-
7
-
8
-
9
-
10
-
11
-
12
-
13
-
14
-
15
-
16
-
17
-
18
-
19
-
20
-
21
-
22
-
23
-
24
-
25
-
26
-
27
-
28
-
29
-
30
-
31
-
32
-
33
-
34
-
35
-
 36
36 -
 37
37 -
 38
38 -
 39
39 -
 40
40 -
 41
41 -
 42
42 -
 43
43 -
 44
44 -
 45
45 -
 46
46 -
 47
47 -
 48
48 -
 49
49 -
 50
50 -
 51
51 -
 52
52 -
 53
53 -
 54
54 -
 55
55 -
 56
56 -
57
-
58
-
59
-
60
-
61
-
62
-
63
-
64
-
65
-
66
-
67
-
68
-
69
-
70
-
71
-
72
-
73
-
74
-
75
-
76
-
77
-
78
-
79
-
80
-
81
-
82
-
83
-
84
-
85
-
86
-
87
-
88
-
89
-
90
-
91
-
92
-
93
-
94
-
95
-
96
-
97
-
98
-
99
-
100
-
101
-
102
-
103
-
104
-
105
-
106
-
107
-
108
-
109
-
110
-
111
-
112
-
113
-
114
-
115
-
116
-
117
-
118
-
119
-
120
-
121
-
122
-
123
-
124
-
125
-
126
-
127
-
128
-
129
-
130
-
131
-
132
-
133
-
134
-
135
-
136
 |
 |

TIME WARNER INC.
MANAGEMENT’S DISCUSSION AND ANALYSIS
OF RESULTS OF OPERATIONS AND FINANCIAL CONDITION – (Continued)
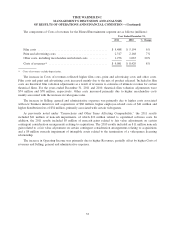
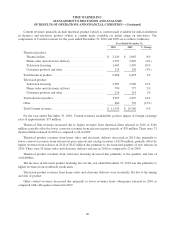
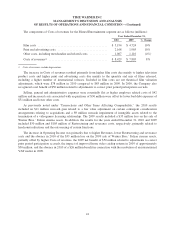
Content revenues primarily relate to theatrical product (which is content made available for initial exhibition
in theaters) and television product (which is content made available for initial airing on television). The
components of Content revenues for the years ended December 31, 2011 and 2010 are as follows (millions):
Year Ended December 31,
2011 2010 % Change
Theatrical product:
Theatrical film ....................................... $ 2,100 $ 2,249 (7%)
Home video and electronic delivery ...................... 2,829 2,707 5%
Television licensing .................................. 1,557 1,605 (3%)
Consumer products and other ........................... 160 125 28%
Total theatrical product .................................. 6,646 6,686 (1%)
Television product:
Television licensing .................................. 3,349 2,987 12%
Home video and electronic delivery ...................... 830 790 5%
Consumer products and other ........................... 245 216 13%
Total television product .................................. 4,424 3,993 11%
Other ................................................ 1,204 680 77%
Total Content revenues .................................. $ 12,274 $ 11,359 8%
The increase in Content revenues for the year ended December 31, 2011 included the net positive impact of
foreign exchange rates of approximately $215 million.
Theatrical product revenues from theatrical film decreased due primarily to lower carryover revenues from
releases in prior periods. There were 22 theatrical films released in 2011 as compared to 23 in 2010.
Theatrical product revenues from home video and electronic delivery increased due to higher carryover
revenues from releases in prior periods and catalog revenues of $94 million and higher revenues from releases in
2011 of $28 million. There were 20 home video and electronic delivery releases in 2011 as compared to 29 in
2010.
Theatrical product revenues from television licensing decreased due primarily to the quantity and mix of
availabilities.
The increase in television product licensing fees was primarily due to higher revenues from worldwide
syndication.
Television product revenues from home video and electronic delivery increased due to higher electronic
delivery revenues of $115 million primarily related to the recognition of revenue associated with a licensing
agreement with Netflix, Inc. (“Netflix”) that allows Netflix’s U.S. members to stream previous seasons of the
scripted series that aired on The CW Network beginning in Fall 2011, as well as previous seasons of new scripted
series produced by Warner Bros. or CBS Corporation that premiere on the network through the 2014-2015
broadcast season, partially offset by lower revenues from consumer packaged goods of $75 million.
Other content revenues increased primarily due to higher revenues from videogames released in 2011 as
compared to videogames released in 2010.
32