Time Magazine 2011 Annual Report Download - page 60
Download and view the complete annual report
Please find page 60 of the 2011 Time Magazine annual report below. You can navigate through the pages in the report by either clicking on the pages listed below, or by using the keyword search tool below to find specific information within the annual report.-
 1
1 -
2
-
3
-
4
-
5
-
6
-
7
-
8
-
9
-
10
-
11
-
12
-
13
-
14
-
15
-
16
-
17
-
18
-
19
-
20
-
21
-
22
-
23
-
24
-
25
-
26
-
27
-
28
-
29
-
30
-
31
-
32
-
33
-
34
-
35
-
36
-
37
-
38
-
39
-
40
-
41
-
42
-
43
-
44
-
45
-
46
-
47
-
48
-
49
-
 50
50 -
 51
51 -
 52
52 -
 53
53 -
 54
54 -
 55
55 -
 56
56 -
 57
57 -
 58
58 -
 59
59 -
 60
60 -
 61
61 -
 62
62 -
 63
63 -
 64
64 -
 65
65 -
 66
66 -
 67
67 -
 68
68 -
 69
69 -
 70
70 -
71
-
72
-
73
-
74
-
75
-
76
-
77
-
78
-
79
-
80
-
81
-
82
-
83
-
84
-
85
-
86
-
87
-
88
-
89
-
90
-
91
-
92
-
93
-
94
-
95
-
96
-
97
-
98
-
99
-
100
-
101
-
102
-
103
-
104
-
105
-
106
-
107
-
108
-
109
-
110
-
111
-
112
-
113
-
114
-
115
-
116
-
117
-
118
-
119
-
120
-
121
-
122
-
123
-
124
-
125
-
126
-
127
-
128
-
129
-
130
-
131
-
132
-
133
-
134
-
135
-
136
 |
 |

TIME WARNER INC.
MANAGEMENT’S DISCUSSION AND ANALYSIS
OF RESULTS OF OPERATIONS AND FINANCIAL CONDITION – (Continued)
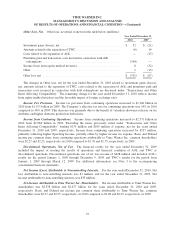
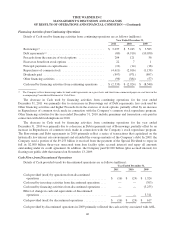
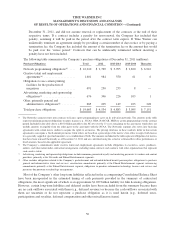
Financing Activities from Continuing Operations
Details of Cash used by financing activities from continuing operations are as follows (millions):
Year Ended December 31,
2011 2010 2009
Borrowings(a) .......................................... $ 3,037 $ 5,243 $ 3,583
Debt repayments(a) ..................................... (80) (4,910) (10,050)
Proceeds from the exercise of stock options ................. 204 121 56
Excess tax benefit on stock options ........................ 22 7 1
Principal payments on capital leases ....................... (12) (14) (18)
Repurchases of common stock ........................... (4,611) (2,016) (1,158)
Dividends paid ........................................ (997) (971) (897)
Other financing activities ................................ (96) (384) (57)
Cash used by financing activities from continuing operations . . . $ (2,533) $ (2,924) $ (8,540)
(a) The Company reflects borrowings under its bank credit agreements on a gross basis and short-term commercial paper on a net basis in the
accompanying Consolidated Statement of Cash Flows.
The decrease in Cash used by financing activities from continuing operations for the year ended
December 31, 2011 was primarily due to an increase in Borrowings net of Debt repayments, less cash used by
Other financing activities and higher Proceeds from the exercise of stock options, partially offset by an increase
in Repurchases of common stock made in connection with the Company’s common stock repurchase program.
Other financing activities for the year ended December 31, 2010 include premiums and transaction costs paid in
connection with debt redemptions in 2010.
The decrease in Cash used by financing activities from continuing operations for the year ended
December 31, 2010 was primarily due to a decrease in Debt repayments net of Borrowings, partially offset by an
increase in Repurchases of common stock made in connection with the Company’s stock repurchase program.
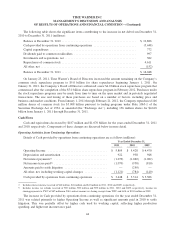
The Borrowings and Debt repayments in 2010 primarily reflect a series of transactions that capitalized on the
historically low interest rate environment and extended the average maturity of the Company’s debt. In 2009, the
Company used a portion of the $9.253 billion it received from the payment of the Special Dividend to repay in
full its $2.000 billion three-year unsecured term loan facility (plus accrued interest) and repay all amounts
outstanding under its credit agreement. In addition, the Company paid $2.000 billion (plus accrued interest) for
floating rate public debt that matured on November 13, 2009.
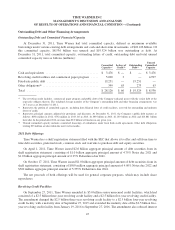
Cash Flows from Discontinued Operations
Details of Cash provided (used) by discontinued operations are as follows (millions):
Year Ended December 31,
2011 2010 2009
Cash provided (used) by operations from discontinued
operations ............................................ $ (16) $ (24) $ 1,324
Cash used by investing activities from discontinued operations . . . . — — (763)
Cash used by financing activities from discontinued operations . . . . — — (5,255)
Effect of change in cash and equivalents of discontinued
operations ............................................ — — 5,311
Cash provided (used) by discontinued operations ............... $ (16) $ (24) $ 617
Cash provided by discontinued operations in 2009 primarily reflected the cash activity associated with AOL.
46