Time Magazine 2011 Annual Report Download - page 58
Download and view the complete annual report
Please find page 58 of the 2011 Time Magazine annual report below. You can navigate through the pages in the report by either clicking on the pages listed below, or by using the keyword search tool below to find specific information within the annual report.-
 1
1 -
2
-
3
-
4
-
5
-
6
-
7
-
8
-
9
-
10
-
11
-
12
-
13
-
14
-
15
-
16
-
17
-
18
-
19
-
20
-
21
-
22
-
23
-
24
-
25
-
26
-
27
-
28
-
29
-
30
-
31
-
32
-
33
-
34
-
35
-
36
-
37
-
38
-
39
-
40
-
41
-
42
-
43
-
44
-
45
-
46
-
47
-
 48
48 -
 49
49 -
 50
50 -
 51
51 -
 52
52 -
 53
53 -
 54
54 -
 55
55 -
 56
56 -
 57
57 -
 58
58 -
 59
59 -
 60
60 -
 61
61 -
 62
62 -
 63
63 -
 64
64 -
 65
65 -
 66
66 -
 67
67 -
 68
68 -
69
-
70
-
71
-
72
-
73
-
74
-
75
-
76
-
77
-
78
-
79
-
80
-
81
-
82
-
83
-
84
-
85
-
86
-
87
-
88
-
89
-
90
-
91
-
92
-
93
-
94
-
95
-
96
-
97
-
98
-
99
-
100
-
101
-
102
-
103
-
104
-
105
-
106
-
107
-
108
-
109
-
110
-
111
-
112
-
113
-
114
-
115
-
116
-
117
-
118
-
119
-
120
-
121
-
122
-
123
-
124
-
125
-
126
-
127
-
128
-
129
-
130
-
131
-
132
-
133
-
134
-
135
-
136
 |
 |

TIME WARNER INC.
MANAGEMENT’S DISCUSSION AND ANALYSIS
OF RESULTS OF OPERATIONS AND FINANCIAL CONDITION – (Continued)
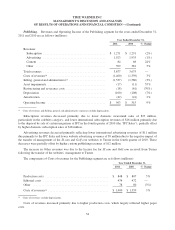
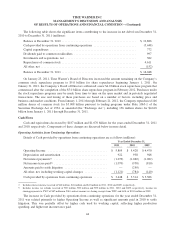
The following table shows the significant items contributing to the increase in net debt from December 31,
2010 to December 31, 2011 (millions):
Balance at December 31, 2010 ................................................. $ 12,886
Cash provided by operations from continuing operations ............................ (3,448)
Capital expenditures ......................................................... 772
Dividends paid to common stockholders ......................................... 997
Investments and acquisitions, net ............................................... 382
Repurchases of common stock ................................................. 4,611
All other, net ............................................................... (152)
Balance at December 31, 2011 ................................................. $ 16,048
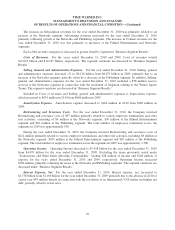
On January 25, 2011, Time Warner’s Board of Directors increased the amount remaining on the Company’s
common stock repurchase program to $5.0 billion for share repurchases beginning January 1, 2011. On
January 31, 2012, the Company’s Board of Directors authorized a new $4.0 billion stock repurchase program that
commenced after the completion of the $5.0 billion share repurchase program in February 2012. Purchases under
the stock repurchase programs may be made from time to time on the open market and in privately negotiated
transactions. The size and timing of these purchases are based on a number of factors, including price and
business and market conditions. From January 1, 2011 through February 21, 2012, the Company repurchased 146
million shares of common stock for $5.008 billion pursuant to trading programs under Rule 10b5-1 of the
Securities Exchange Act of 1934, as amended (the “Exchange Act”), including 136 million shares for $4.618
billion from January 1, 2011 through December 31, 2011.
Cash Flows
Cash and equivalents decreased by $187 million and $1.070 billion for the years ended December 31, 2011
and 2010, respectively. Components of these changes are discussed below in more detail.
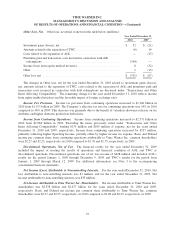
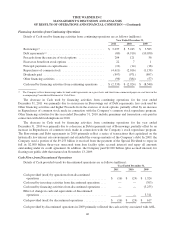
Operating Activities from Continuing Operations
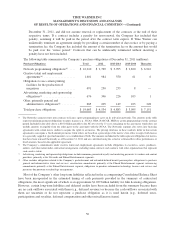
Details of Cash provided by operations from continuing operations are as follows (millions):
Year Ended December 31,
2011 2010 2009
Operating Income ....................................... $ 5,805 $ 5,428 $ 4,470
Depreciation and amortization .............................. 922 938 948
Net interest payments(a) ................................... (1,079) (1,060) (1,082)
Net income taxes paid(b) ................................... (1,079) (958) (810)
Amounts paid to settle litigation ............................ — (250) —
All other, net, including working capital changes ............... (1,121) (784) (140)
Cash provided by operations from continuing operations ......... $ 3,448 $ 3,314 $ 3,386
(a) Includes interest income received of $40 million, $26 million and $43 million in 2011, 2010 and 2009, respectively.
(b) Includes income tax refunds received of $95 million, $90 million and $99 million in 2011, 2010 and 2009, respectively, income tax
sharing payments to TWC of $87 million in 2010 and net income tax sharing receipts from TWC and AOL of $241 million in 2009.
The increase in Cash provided by operations from continuing operations for the year ended December 31,
2011 was related primarily to higher Operating Income as well as significant amounts paid in 2010 to settle
litigation. This was partially offset by higher cash used by working capital, reflecting higher production
spending, and higher net income taxes paid.
44