Time Magazine 2011 Annual Report Download - page 118
Download and view the complete annual report
Please find page 118 of the 2011 Time Magazine annual report below. You can navigate through the pages in the report by either clicking on the pages listed below, or by using the keyword search tool below to find specific information within the annual report.-
 1
1 -
2
-
3
-
4
-
5
-
6
-
7
-
8
-
9
-
10
-
11
-
12
-
13
-
14
-
15
-
16
-
17
-
18
-
19
-
20
-
21
-
22
-
23
-
24
-
25
-
26
-
27
-
28
-
29
-
30
-
31
-
32
-
33
-
34
-
35
-
36
-
37
-
38
-
39
-
40
-
41
-
42
-
43
-
44
-
45
-
46
-
47
-
48
-
49
-
50
-
51
-
52
-
53
-
54
-
55
-
56
-
57
-
58
-
59
-
60
-
61
-
62
-
63
-
64
-
65
-
66
-
67
-
68
-
69
-
70
-
71
-
72
-
73
-
74
-
75
-
76
-
77
-
78
-
79
-
80
-
81
-
82
-
83
-
84
-
85
-
86
-
87
-
88
-
89
-
90
-
91
-
92
-
93
-
94
-
95
-
96
-
97
-
98
-
99
-
100
-
101
-
102
-
103
-
104
-
105
-
106
-
107
-
 108
108 -
 109
109 -
 110
110 -
 111
111 -
 112
112 -
 113
113 -
 114
114 -
 115
115 -
 116
116 -
 117
117 -
 118
118 -
 119
119 -
 120
120 -
 121
121 -
 122
122 -
 123
123 -
 124
124 -
 125
125 -
 126
126 -
 127
127 -
 128
128 -
129
-
130
-
131
-
132
-
133
-
134
-
135
-
136
 |
 |

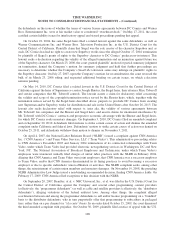
TIME WARNER INC.
NOTES TO CONSOLIDATED FINANCIAL STATEMENTS – (Continued)
Year Ended December 31,
2011 2010 2009
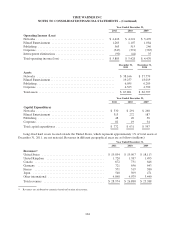
Operating Income (Loss)
Networks ............................................. $ 4,416 $ 4,224 $ 3,470
Filmed Entertainment ................................... 1,263 1,107 1,084
Publishing ............................................ 563 515 246
Corporate ............................................. (347) (374) (365)
Intersegment eliminations ................................ (90) (44) 35
Total operating income (loss) ............................. $ 5,805 $ 5,428 $ 4,470
December 31,
2011
December 31,
2010
Assets
Networks ................................................... $ 38,166 $ 37,779
Filmed Entertainment .......................................... 19,257 18,019
Publishing ................................................... 6,055 6,209
Corporate ................................................... 4,323 4,700
Total assets .................................................. $ 67,801 $ 66,707
Year Ended December 31,
2011 2010 2009
Capital Expenditures
Networks ............................................. $ 330 $ 291 $ 268
Filmed Entertainment ................................... 313 272 187
Publishing ............................................ 48 49 58
Corporate ............................................. 81 19 34
Total capital expenditures ................................ $ 772 $ 631 $ 547
Long-lived hard assets located outside the United States, which represent approximately 1% of total assets at
December 31, 2011, are not material. Revenues in different geographical areas are as follows (millions):
Year Ended December 31,
2011 2010 2009
Revenues(a)
United States ......................................... $ 19,894 $ 19,007 $ 18,113
United Kingdom ...................................... 1,720 1,387 1,495
Canada .............................................. 672 731 646
Germany ............................................ 721 656 643
France .............................................. 571 519 580
Japan ............................................... 548 509 471
Other international ..................................... 4,848 4,079 3,440
Total revenues ........................................ $ 28,974 $ 26,888 $ 25,388
(a) Revenues are attributed to countries based on location of customer.
104