Time Magazine 2011 Annual Report Download - page 54
Download and view the complete annual report
Please find page 54 of the 2011 Time Magazine annual report below. You can navigate through the pages in the report by either clicking on the pages listed below, or by using the keyword search tool below to find specific information within the annual report.-
 1
1 -
2
-
3
-
4
-
5
-
6
-
7
-
8
-
9
-
10
-
11
-
12
-
13
-
14
-
15
-
16
-
17
-
18
-
19
-
20
-
21
-
22
-
23
-
24
-
25
-
26
-
27
-
28
-
29
-
30
-
31
-
32
-
33
-
34
-
35
-
36
-
37
-
38
-
39
-
40
-
41
-
42
-
43
-
 44
44 -
 45
45 -
 46
46 -
 47
47 -
 48
48 -
 49
49 -
 50
50 -
 51
51 -
 52
52 -
 53
53 -
 54
54 -
 55
55 -
 56
56 -
 57
57 -
 58
58 -
 59
59 -
 60
60 -
 61
61 -
 62
62 -
 63
63 -
 64
64 -
65
-
66
-
67
-
68
-
69
-
70
-
71
-
72
-
73
-
74
-
75
-
76
-
77
-
78
-
79
-
80
-
81
-
82
-
83
-
84
-
85
-
86
-
87
-
88
-
89
-
90
-
91
-
92
-
93
-
94
-
95
-
96
-
97
-
98
-
99
-
100
-
101
-
102
-
103
-
104
-
105
-
106
-
107
-
108
-
109
-
110
-
111
-
112
-
113
-
114
-
115
-
116
-
117
-
118
-
119
-
120
-
121
-
122
-
123
-
124
-
125
-
126
-
127
-
128
-
129
-
130
-
131
-
132
-
133
-
134
-
135
-
136
 |
 |

TIME WARNER INC.
MANAGEMENT’S DISCUSSION AND ANALYSIS
OF RESULTS OF OPERATIONS AND FINANCIAL CONDITION – (Continued)
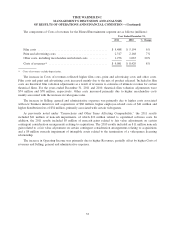
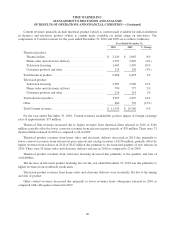
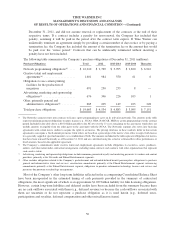
Content revenues primarily include theatrical product (which is content made available for initial exhibition
in theaters) and television product (which is content made available for initial airing on television). The
components of Content revenues for the years ended December 31, 2010 and 2009 are as follows (millions):
Year Ended December 31,
2010 2009 % Change
Theatrical product:
Theatrical film ...................................... $ 2,249 $ 2,085 8%
Home video and electronic delivery ..................... 2,707 2,820 (4%)
Television licensing ................................. 1,605 1,459 10%
Consumer products and other .......................... 125 129 (3%)
Total theatrical product ................................. 6,686 6,493 3%
Television product:
Television licensing ................................. 2,987 2,506 19%
Home video and electronic delivery ..................... 790 777 2%
Consumer products and other .......................... 216 214 1%
Total television product ................................. 3,993 3,497 14%
Other ............................................... 680 776 (12%)
Total Content revenues ................................. $ 11,359 $ 10,766 6%
For the year ended December 31, 2010, Content revenues included the positive impact of foreign exchange
rates of approximately $75 million.
Theatrical film revenues increased due to higher revenues from theatrical films released in 2010 of $240
million, partially offset by lower carryover revenues from releases in prior periods of $76 million. There were 23
theatrical films released in 2010 as compared to 26 in 2009.
Theatrical product revenues from home video and electronic delivery decreased in 2010 due primarily to
lower carryover revenues from releases in prior periods and catalog revenues of $256 million, partially offset by
higher revenues from releases in 2010 of $143 million due primarily to the increased quantity of new releases in
2010. There were 29 home video and electronic delivery releases in 2010 as compared to 22 in 2009.
Theatrical product revenues from television licensing increased due primarily to the quantity and mix of
availabilities.
The increase in television product licensing fees for the year ended December 31, 2010 was due primarily to
higher revenues from worldwide syndication.
Television product revenues from home video and electronic delivery were essentially flat due to the timing
and mix of product.
Other content revenues decreased due primarily to lower revenues from videogames released in 2010 as
compared with videogames released in 2009.
40