Time Magazine 2011 Annual Report Download - page 56
Download and view the complete annual report
Please find page 56 of the 2011 Time Magazine annual report below. You can navigate through the pages in the report by either clicking on the pages listed below, or by using the keyword search tool below to find specific information within the annual report.-
 1
1 -
2
-
3
-
4
-
5
-
6
-
7
-
8
-
9
-
10
-
11
-
12
-
13
-
14
-
15
-
16
-
17
-
18
-
19
-
20
-
21
-
22
-
23
-
24
-
25
-
26
-
27
-
28
-
29
-
30
-
31
-
32
-
33
-
34
-
35
-
36
-
37
-
38
-
39
-
40
-
41
-
42
-
43
-
44
-
45
-
 46
46 -
 47
47 -
 48
48 -
 49
49 -
 50
50 -
 51
51 -
 52
52 -
 53
53 -
 54
54 -
 55
55 -
 56
56 -
 57
57 -
 58
58 -
 59
59 -
 60
60 -
 61
61 -
 62
62 -
 63
63 -
 64
64 -
 65
65 -
 66
66 -
67
-
68
-
69
-
70
-
71
-
72
-
73
-
74
-
75
-
76
-
77
-
78
-
79
-
80
-
81
-
82
-
83
-
84
-
85
-
86
-
87
-
88
-
89
-
90
-
91
-
92
-
93
-
94
-
95
-
96
-
97
-
98
-
99
-
100
-
101
-
102
-
103
-
104
-
105
-
106
-
107
-
108
-
109
-
110
-
111
-
112
-
113
-
114
-
115
-
116
-
117
-
118
-
119
-
120
-
121
-
122
-
123
-
124
-
125
-
126
-
127
-
128
-
129
-
130
-
131
-
132
-
133
-
134
-
135
-
136
 |
 |

TIME WARNER INC.
MANAGEMENT’S DISCUSSION AND ANALYSIS
OF RESULTS OF OPERATIONS AND FINANCIAL CONDITION – (Continued)
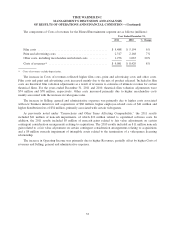
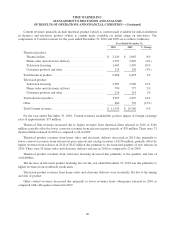
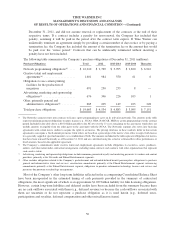
Publishing. Revenues and Operating Income of the Publishing segment for the years ended December 31,
2010 and 2009 are as follows (millions):
Year Ended December 31,
2010 2009 % Change
Revenues:
Subscription ........................................ $ 1,291 $ 1,324 (2%)
Advertising ......................................... 1,935 1,878 3%
Content ............................................ 68 73 (7%)
Other .............................................. 381 461 (17%)
Total revenues ........................................ 3,675 3,736 (2%)
Costs of revenues(a) ..................................... (1,359) (1,441) (6%)
Selling, general and administrative(a) ....................... (1,580) (1,744) (9%)
Asset impairments ..................................... (11) (33) (67%)
Restructuring and severance costs ......................... (61) (99) (38%)
Depreciation .......................................... (108) (126) (14%)
Amortization ......................................... (41) (47) (13%)
Operating Income ...................................... $ 515 $ 246 109%
(a) Costs of revenues and Selling, general and administrative expenses exclude depreciation.
Subscription revenues decreased primarily due to a $23 million decline in domestic subscription revenues
and lower domestic newsstand revenues of $9 million.
Advertising revenues increased primarily due to a $36 million increase in domestic magazine advertising
revenues due to improvements in domestic print advertising pages sold, partially offset by lower average
advertising rates per page, and a $20 million increase in website advertising revenues. Growth in website
advertising revenues at the Publishing segment was negatively affected by the transfer of management to Turner
in the fourth quarter of 2010 of the SI.com and Golf.com websites, including selling the advertising for the
websites. This transfer had a commensurate increase in website advertising revenues at the Networks segment.
The decrease in Other revenues is due primarily to declines at non-magazine businesses, including a decline
due to the sale of Southern Living At Home in the third quarter of 2009.
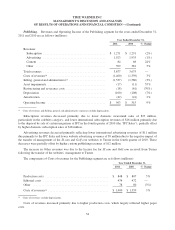
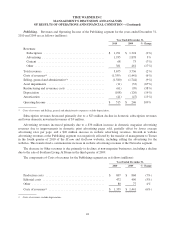
The components of Costs of revenues for the Publishing segment are as follows (millions):
Year Ended December 31,
2010 2009 % Change
Production costs ....................................... $ 807 $ 868 (7%)
Editorial costs ......................................... 472 496 (5%)
Other ................................................ 80 77 4%
Costs of revenues(a) ..................................... $ 1,359 $ 1,441 (6%)
(a) Costs of revenues exclude depreciation.
42