Time Magazine 2011 Annual Report Download - page 117
Download and view the complete annual report
Please find page 117 of the 2011 Time Magazine annual report below. You can navigate through the pages in the report by either clicking on the pages listed below, or by using the keyword search tool below to find specific information within the annual report.-
 1
1 -
2
-
3
-
4
-
5
-
6
-
7
-
8
-
9
-
10
-
11
-
12
-
13
-
14
-
15
-
16
-
17
-
18
-
19
-
20
-
21
-
22
-
23
-
24
-
25
-
26
-
27
-
28
-
29
-
30
-
31
-
32
-
33
-
34
-
35
-
36
-
37
-
38
-
39
-
40
-
41
-
42
-
43
-
44
-
45
-
46
-
47
-
48
-
49
-
50
-
51
-
52
-
53
-
54
-
55
-
56
-
57
-
58
-
59
-
60
-
61
-
62
-
63
-
64
-
65
-
66
-
67
-
68
-
69
-
70
-
71
-
72
-
73
-
74
-
75
-
76
-
77
-
78
-
79
-
80
-
81
-
82
-
83
-
84
-
85
-
86
-
87
-
88
-
89
-
90
-
91
-
92
-
93
-
94
-
95
-
96
-
97
-
98
-
99
-
100
-
101
-
102
-
103
-
104
-
105
-
106
-
 107
107 -
 108
108 -
 109
109 -
 110
110 -
 111
111 -
 112
112 -
 113
113 -
 114
114 -
 115
115 -
 116
116 -
 117
117 -
 118
118 -
 119
119 -
 120
120 -
 121
121 -
 122
122 -
 123
123 -
 124
124 -
 125
125 -
 126
126 -
 127
127 -
128
-
129
-
130
-
131
-
132
-
133
-
134
-
135
-
136
 |
 |

TIME WARNER INC.
NOTES TO CONSOLIDATED FINANCIAL STATEMENTS – (Continued)
Year Ended December 31, 2010
Subscription Advertising Content Other Total
Revenues
Networks ........................ $ 7,671 $ 3,736 $ 942 $ 131 $ 12,480
Filmed Entertainment ............... 66 75 11,359 122 11,622
Publishing ........................ 1,291 1,935 68 381 3,675
Intersegment eliminations ........... — (64) (804) (21) (889)
Total revenues .................... $ 9,028 $ 5,682 $ 11,565 $ 613 $ 26,888
Year Ended December 31, 2009
Subscription Advertising Content Other Total
Revenues
Networks ........................ $ 7,077 $ 3,272 $ 819 $ 85 $ 11,253
Filmed Entertainment ............... 44 79 10,766 177 11,066
Publishing ........................ 1,324 1,878 73 461 3,736
Intersegment eliminations ........... — (68) (584) (15) (667)
Total revenues .................... $ 8,445 $ 5,161 $ 11,074 $ 708 $ 25,388
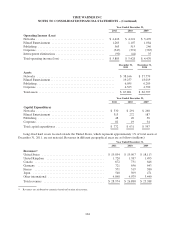
Year Ended December 31,
2011 2010 2009
Intersegment Revenues
Networks .................................................. $ 92 $ 89 $ 89
Filmed Entertainment ......................................... 854 778 565
Publishing .................................................. 49 22 13
Total intersegment revenues ................................... $ 995 $ 889 $ 667
Year Ended December 31,
2011 2010 2009
Depreciation of Property, Plant and Equipment
Networks .................................................. $ (326) $ (342) $ (338)
Filmed Entertainment ........................................ (198) (186) (164)
Publishing ................................................. (100) (108) (126)
Corporate .................................................. (29) (38) (40)
Total depreciation of property, plant and equipment ................ $ (653) $ (674) $ (668)
Year Ended December 31,
2011 2010 2009
Amortization of Intangible Assets
Networks .................................................. $ (41) $ (35) $ (34)
Filmed Entertainment ........................................ (186) (188) (199)
Publishing ................................................. (42) (41) (47)
Total amortization of intangible assets ........................... $ (269) $ (264) $ (280)
103