Time Magazine 2011 Annual Report Download - page 44
Download and view the complete annual report
Please find page 44 of the 2011 Time Magazine annual report below. You can navigate through the pages in the report by either clicking on the pages listed below, or by using the keyword search tool below to find specific information within the annual report.-
 1
1 -
2
-
3
-
4
-
5
-
6
-
7
-
8
-
9
-
10
-
11
-
12
-
13
-
14
-
15
-
16
-
17
-
18
-
19
-
20
-
21
-
22
-
23
-
24
-
25
-
26
-
27
-
28
-
29
-
30
-
31
-
32
-
33
-
 34
34 -
 35
35 -
 36
36 -
 37
37 -
 38
38 -
 39
39 -
 40
40 -
 41
41 -
 42
42 -
 43
43 -
 44
44 -
 45
45 -
 46
46 -
 47
47 -
 48
48 -
 49
49 -
 50
50 -
 51
51 -
 52
52 -
 53
53 -
 54
54 -
55
-
56
-
57
-
58
-
59
-
60
-
61
-
62
-
63
-
64
-
65
-
66
-
67
-
68
-
69
-
70
-
71
-
72
-
73
-
74
-
75
-
76
-
77
-
78
-
79
-
80
-
81
-
82
-
83
-
84
-
85
-
86
-
87
-
88
-
89
-
90
-
91
-
92
-
93
-
94
-
95
-
96
-
97
-
98
-
99
-
100
-
101
-
102
-
103
-
104
-
105
-
106
-
107
-
108
-
109
-
110
-
111
-
112
-
113
-
114
-
115
-
116
-
117
-
118
-
119
-
120
-
121
-
122
-
123
-
124
-
125
-
126
-
127
-
128
-
129
-
130
-
131
-
132
-
133
-
134
-
135
-
136
 |
 |

TIME WARNER INC.
MANAGEMENT’S DISCUSSION AND ANALYSIS
OF RESULTS OF OPERATIONS AND FINANCIAL CONDITION – (Continued)
Business Segment Results
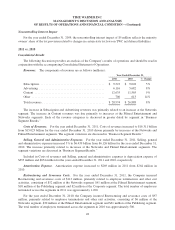
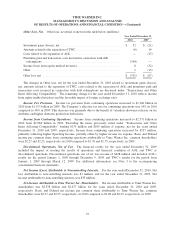
Networks. Revenues and Operating Income of the Networks segment for the years ended December 31,
2011 and 2010 are as follows (millions):
Year Ended December 31,
2011 2010 % Change
Revenues:
Subscription ......................................... $ 8,166 $ 7,671 6%
Advertising ......................................... 4,189 3,736 12%
Content ............................................ 1,144 942 21%
Other .............................................. 155 131 18%
Total revenues ......................................... 13,654 12,480 9%
Costs of revenues(a) ...................................... (6,403) (5,732) 12%
Selling, general and administrative(a) ........................ (2,408) (2,200) 9%
Gain (loss) on operating assets ............................ (2) 59 (103%)
Asset impairments ...................................... (6) — NM
Restructuring and severance costs .......................... (52) (6) NM
Depreciation .......................................... (326) (342) (5%)
Amortization .......................................... (41) (35) 17%
Operating Income ...................................... $ 4,416 $ 4,224 5%
(a) Costs of revenues and Selling, general and administrative expenses exclude depreciation.
The increase in Subscription revenues consisted of an increase in domestic subscription revenues of $337
million, mainly due to higher domestic subscription rates, and an increase in international subscription revenues
of $158 million, primarily due to international subscriber growth.
The increase in Advertising revenues reflected domestic growth of $301 million, mainly due to strong
pricing and Turner airing the NCAA Division I Men’s Basketball Championship events (the “NCAA
Tournament”). International advertising revenues increased $152 million, primarily due to international growth,
including acquisitions. The Company anticipates that the growth rate for Advertising revenues at the Networks
segment during 2012 will be lower than that experienced during 2011 because it was the first year of Turner
airing the NCAA Tournament.
The increase in Content revenues was due primarily to higher licensing revenues of $105 million at Turner
and higher sales of Home Box Office’s original programming of $97 million.
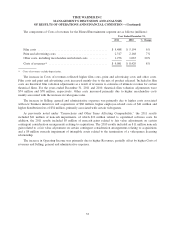
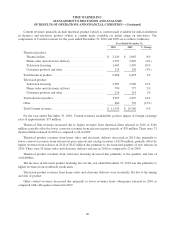
The components of Costs of revenues for the Networks segment are as follows (millions):
Year Ended December 31,
2011 2010 % Change
Programming costs:
Originals and sports .................................... $ 3,168 $ 2,661 19%
Acquired films and syndicated series ....................... 1,836 1,824 1%
Total programming costs .................................. 5,004 4,485 12%
Other direct operating costs ................................ 1,399 1,247 12%
Costs of revenues(a) ....................................... $ 6,403 $ 5,732 12%
(a) Costs of revenues exclude depreciation.
30