Royal Caribbean Cruise Lines 2009 Annual Report Download - page 93
Download and view the complete annual report
Please find page 93 of the 2009 Royal Caribbean Cruise Lines annual report below. You can navigate through the pages in the report by either clicking on the pages listed below, or by using the keyword search tool below to find specific information within the annual report.-
 1
1 -
2
-
3
-
4
-
5
-
6
-
7
-
8
-
9
-
10
-
11
-
12
-
13
-
14
-
15
-
16
-
17
-
18
-
19
-
20
-
21
-
22
-
23
-
24
-
25
-
26
-
27
-
28
-
29
-
30
-
31
-
32
-
33
-
34
-
35
-
36
-
37
-
38
-
39
-
40
-
41
-
42
-
43
-
44
-
45
-
46
-
47
-
48
-
49
-
50
-
51
-
52
-
53
-
54
-
55
-
56
-
57
-
58
-
59
-
60
-
61
-
62
-
63
-
64
-
65
-
66
-
67
-
68
-
69
-
70
-
71
-
72
-
73
-
74
-
75
-
76
-
77
-
78
-
79
-
80
-
81
-
82
-
 83
83 -
 84
84 -
 85
85 -
 86
86 -
 87
87 -
 88
88 -
 89
89 -
 90
90 -
 91
91 -
 92
92 -
 93
93 -
 94
94 -
 95
95 -
 96
96 -
 97
97 -
 98
98 -
 99
99 -
 100
100 -
 101
101 -
 102
102 -
 103
103 -
104
-
105
-
106
-
107
-
108
-
109
 |
 |

ROYAL CARIBBEAN CRUISES LTD.
NOTES TO THE CONSOLIDATED FINANCIAL STATEMENTS—(Continued)
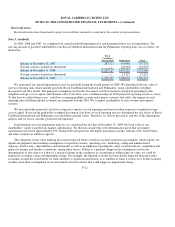
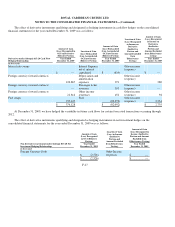
Note 13. Fair Value Measurements and Derivative Instruments
Fair Value Measurements
The Company uses quoted prices in active markets when available to determine the fair value of its financial instruments. The
estimated fair value of our financial instruments that are not measured at fair value on a recurring basis are as follows (in thousands):
Long-Term Debt
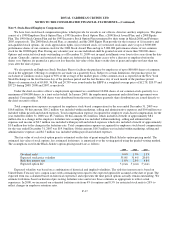
The fair values of our senior notes and senior debentures were estimated by obtaining quoted market prices. The fair values of
all other debt were estimated using the present value of expected future cash flows which incorporates our risk profile.
Other Financial Instruments
The carrying amounts of cash and cash equivalents, accounts receivable, accounts payable, accrued interest and accrued
expenses approximate fair value at December 31, 2009 and December 31, 2008.
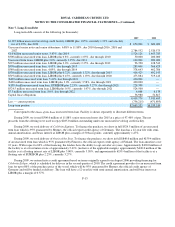
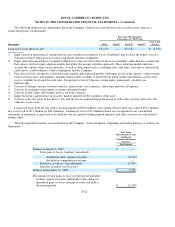
In addition, assets and liabilities that are recorded at fair value have been categorized based upon the fair value hierarchy.
The following table presents information about the Company’s financial instruments recorded at fair value on a recurring basis
(in thousands):
F-20
At December 31,
2009
At December 31,
2008
Long-term debt (including current portion of long-term debt)
$7,744,915
$5,132,547
Fair Value Measurements
at December 31, 2009 Usin
g
Fair Value Measurements
at December 31, 2008 Usin
g
Descri
p
tion Total Level 1 Level 2 Level 3 Total Level 1 Level 2 Level 3
Assets:
Derivative financial instruments
$385,760
—
375,762
9,998
$284,175
—
284,175
—
Investments
$8,923
8,923
—
—
$14,238
14,238
—
—
Total Assets
$394,683
$8,923
$375,762
$9,998
$298,413
$14,238
$284,175
$—
Liabilities:
Derivative financial instruments
$79,337
—
79,337
—
$360,941
—
360,941
—
Total Liabilities
$79,337
$
—
$79,337
$
—
$360,941
$
—
$360,941
$
—
123 1 23
4
5
6