Royal Caribbean Cruise Lines 2009 Annual Report Download - page 49
Download and view the complete annual report
Please find page 49 of the 2009 Royal Caribbean Cruise Lines annual report below. You can navigate through the pages in the report by either clicking on the pages listed below, or by using the keyword search tool below to find specific information within the annual report.-
 1
1 -
2
-
3
-
4
-
5
-
6
-
7
-
8
-
9
-
10
-
11
-
12
-
13
-
14
-
15
-
16
-
17
-
18
-
19
-
20
-
21
-
22
-
23
-
24
-
25
-
26
-
27
-
28
-
29
-
30
-
31
-
32
-
33
-
34
-
35
-
36
-
37
-
38
-
 39
39 -
 40
40 -
 41
41 -
 42
42 -
 43
43 -
 44
44 -
 45
45 -
 46
46 -
 47
47 -
 48
48 -
 49
49 -
 50
50 -
 51
51 -
 52
52 -
 53
53 -
 54
54 -
 55
55 -
 56
56 -
 57
57 -
 58
58 -
 59
59 -
60
-
61
-
62
-
63
-
64
-
65
-
66
-
67
-
68
-
69
-
70
-
71
-
72
-
73
-
74
-
75
-
76
-
77
-
78
-
79
-
80
-
81
-
82
-
83
-
84
-
85
-
86
-
87
-
88
-
89
-
90
-
91
-
92
-
93
-
94
-
95
-
96
-
97
-
98
-
99
-
100
-
101
-
102
-
103
-
104
-
105
-
106
-
107
-
108
-
109
 |
 |

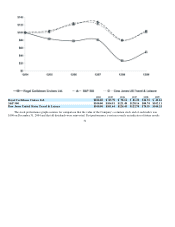
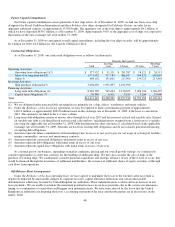
Occupancy, in accordance with cruise vacation industry practice, is calculated by dividing Passenger Cruise Days by APCD. A
percentage in excess of 100% indicates that three or more passengers occupied some cabins.
Passenger Cruise Days represent the number of passengers carried for the period multiplied by the number of days of their
respective cruises.
The use of certain significant non-GAAP measures, such as Net Yields and Net Cruise Costs, allow us to perform capacity and
rate analysis to separate the impact of known capacity changes from other less predictable changes which affect our business. We
believe these non-GAAP measures provide expanded insight to measure revenue and cost performance in addition to the standard
United States GAAP based financial measures. There are no specific rules or regulations for determining non-GAAP measures, and as
such, there exists the possibility that they may not be comparable to other companies within the industry.
Executive Overview
Total revenues were $5.9 billion in 2009 compared to total revenues of $6.5 billion in 2008. Our financial results have been, and
may continue to be, negatively affected by the economic environment including the high unemployment rates in certain markets. This
challenging economic environment has strained consumer discretionary spending, which in turn has caused a diminished demand for
our cruises and land-based tours to Mexico and the Caribbean. In addition, the adverse impact of the H1N1 flu virus had a significant
effect on Pullmantur’s operations during 2009. Nonetheless, we believe the resiliency of the cruise vacation industry coupled with the
endurance of our brands allowed us to mitigate, to an extent, the impact of the economic environment on our 2009 results.
In late 2009, we began to experience growth in our order book and a diminishing gap in year-over-year booked volume
comparisons. This acceleration in booking volumes has had a positive effect on pricing, which is running ahead of the same time last
year. In addition, the design of our Solstice and Oasis-class ships allows for a greater percentage of staterooms with verandas and
outside staterooms which provide for premiums in pricing. Although we are not back to pre-recession demand levels, there is solid
yield recovery underway. As a result, we expect 2010 Net Yields to increase in the range of 3% to 6% compared to 2009.
Furthermore, we have responded to the operating environment by continuously improving our cost focus through the
implementation of new cost-containment initiatives including the renegotiation of long-term contracts with our vendors and a detailed
emphasis on cost control. In addition, our Solstice and Oasis-class ships provide us with cost efficiencies through their scale and fuel
efficiencies. We expect our 2010 Net Cruise Costs per APCD to be from flat to up slightly compared to 2009.
While cutting costs throughout the organization, we have not altered our strategy of substantially growing our sourcing of
international guests. We continue to opportunistically increase our investments in growth outside North America with the goal of
diversifying our sources and increasing opportunities for revenue growth. We are also continuing our strategy of tactically spending
to maintain brand standards.
Lastly, we believe the credit and capital markets have begun to stabilize. This has improved our ability to secure financing and
raise additional capital on terms that are acceptable to us. We currently have three Solstice-class vessels and one Oasis-class vessel
under construction, all of which have committed bank financing arrangements. We anticipate funding our scheduled maturities in
2010 through operating cash flows and do not foresee a need to access the capital markets during 2010 although we may
opportunistically decide to do so. We are also continuing to pursue our long-term objective of returning to investment grade rating.
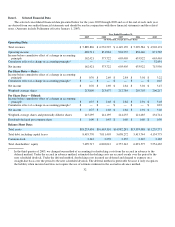
Summary of Historical Results of Operations
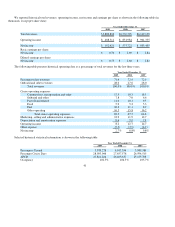
Total revenues decreased 9.8% to $5.9 billion in 2009 from total revenues of $6.5 billion in 2008 primarily due to the decrease
in ticket prices. Net Yields decreased by approximately 14.2% compared to 2008. The decrease in Net Yields was primarily due to the
decrease in ticket prices, partially offset by decreases in operating expenses. As a result, our net income was $162.4 million or $0.75
per share on a diluted basis for 2009 compared to $573.7 million or $2.68 per share on a diluted basis for 2008.
39