Royal Caribbean Cruise Lines 2009 Annual Report Download - page 76
Download and view the complete annual report
Please find page 76 of the 2009 Royal Caribbean Cruise Lines annual report below. You can navigate through the pages in the report by either clicking on the pages listed below, or by using the keyword search tool below to find specific information within the annual report.-
 1
1 -
2
-
3
-
4
-
5
-
6
-
7
-
8
-
9
-
10
-
11
-
12
-
13
-
14
-
15
-
16
-
17
-
18
-
19
-
20
-
21
-
22
-
23
-
24
-
25
-
26
-
27
-
28
-
29
-
30
-
31
-
32
-
33
-
34
-
35
-
36
-
37
-
38
-
39
-
40
-
41
-
42
-
43
-
44
-
45
-
46
-
47
-
48
-
49
-
50
-
51
-
52
-
53
-
54
-
55
-
56
-
57
-
58
-
59
-
60
-
61
-
62
-
63
-
64
-
65
-
 66
66 -
 67
67 -
 68
68 -
 69
69 -
 70
70 -
 71
71 -
 72
72 -
 73
73 -
 74
74 -
 75
75 -
 76
76 -
 77
77 -
 78
78 -
 79
79 -
 80
80 -
 81
81 -
 82
82 -
 83
83 -
 84
84 -
 85
85 -
 86
86 -
87
-
88
-
89
-
90
-
91
-
92
-
93
-
94
-
95
-
96
-
97
-
98
-
99
-
100
-
101
-
102
-
103
-
104
-
105
-
106
-
107
-
108
-
109
 |
 |

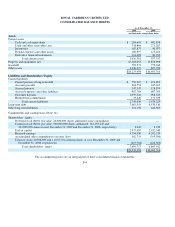
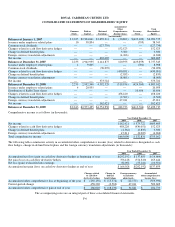
ROYAL CARIBBEAN CRUISES LTD.
CONSOLIDATED STATEMENTS OF OPERATIONS
The accompanying notes are an integral part of these consolidated financial statements.
F-3
Year Ended December 31,
2009 2008 2007
(in thousands, exce
p
t
p
er share data)
Passenger ticket revenues
$4,205,709
$4,730,289
$4,427,384
Onboard and other revenues
1,684,117
1,802,236
1,721,755
Total revenues
5,889,826
6,532,525
6,149,139
Cruise operating expenses:
Commissions, transportation and other
1,028,867
1,192,316
1,124,022
Onboard and other
457,772
458,385
405,637
Payroll and related
681,852
657,721
584,081
Food
345,272
342,620
322,996
Fuel
600,203
722,007
546,029
Other operating
957,136
1,030,617
998,933
Total cruise operating expenses
4,071,102
4,403,666
3,981,698
Marketing, selling and administrative expenses
761,999
776,522
783,040
Depreciation and amortization expenses
568,214
520,353
483,066
5,401,315
5,700,541
5,247,804
O
p
eratin
g
Income
488,511
831,984
901,335
Other income (expense):
Interest income
7,016
14,116
20,025
Interest expense, net of interest capitalized
(300,012)
(327,312)
(333,784)
Other (expense) income
(33,094)
54,934
15,829
(326,090)
(258,262)
(297,930)
Net Income
$162,421
$573,722
$603,405
Basic Earnin
g
s
p
er Share:
Net income
$0.76
$2.69
$2.84
Diluted Earnin
g
s
p
er Share:
Net income
$0.75
$2.68
$2.82