Royal Caribbean Cruise Lines 2009 Annual Report Download - page 51
Download and view the complete annual report
Please find page 51 of the 2009 Royal Caribbean Cruise Lines annual report below. You can navigate through the pages in the report by either clicking on the pages listed below, or by using the keyword search tool below to find specific information within the annual report.-
 1
1 -
2
-
3
-
4
-
5
-
6
-
7
-
8
-
9
-
10
-
11
-
12
-
13
-
14
-
15
-
16
-
17
-
18
-
19
-
20
-
21
-
22
-
23
-
24
-
25
-
26
-
27
-
28
-
29
-
30
-
31
-
32
-
33
-
34
-
35
-
36
-
37
-
38
-
39
-
40
-
 41
41 -
 42
42 -
 43
43 -
 44
44 -
 45
45 -
 46
46 -
 47
47 -
 48
48 -
 49
49 -
 50
50 -
 51
51 -
 52
52 -
 53
53 -
 54
54 -
 55
55 -
 56
56 -
 57
57 -
 58
58 -
 59
59 -
 60
60 -
 61
61 -
62
-
63
-
64
-
65
-
66
-
67
-
68
-
69
-
70
-
71
-
72
-
73
-
74
-
75
-
76
-
77
-
78
-
79
-
80
-
81
-
82
-
83
-
84
-
85
-
86
-
87
-
88
-
89
-
90
-
91
-
92
-
93
-
94
-
95
-
96
-
97
-
98
-
99
-
100
-
101
-
102
-
103
-
104
-
105
-
106
-
107
-
108
-
109
 |
 |

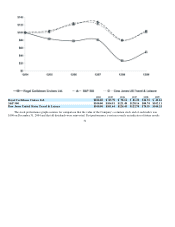
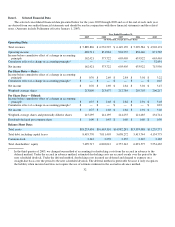
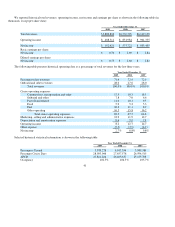
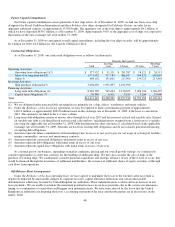
We reported historical total revenues, operating income, net income and earnings per share as shown in the following table (in
thousands, except per share data):
The following table presents historical operating data as a percentage of total revenues for the last three years:
Selected historical statistical information is shown in the following table:
41
Year Ended December 31,
2009 2008 2007
Total revenues
$5,889,826
$6,532,525
$6,149,139
Operating income
$ 488,511
$ 831,984
$ 901,335
Net income
$162,421
$573,722
$603,405
Basic earnings per share:
Net income
$0.76
$2.69
$2.84
Diluted earnings per share:
Net income
$0.75
$2.68
$2.82
Year Ended December 31,
2009 2008 2007
Passenger ticket revenues
71.4
72.4
72.0
Onboard and other revenues
28.6
27.6
28.0
Total revenues
100.0%
100.0%
100.0%
Cruise operating expenses
Commissions, transportation and other
17.5 18.3
18.3
Onboard and other
7.8
7.0
6.6
Payroll and related
11.6
10.1
9.5
Food
5.9
5.2
5.3
Fuel
10.2
11.1
8.9
Other operating
16.3
15.8
16.2
Total cruise operating expenses
69.3
67.5
64.8
Marketing, selling and administrative expenses
12.9
11.9
12.7
Depreciation and amortization expenses
9.6
7.9
7.8
Operating income
8.2
12.7
14.7
Other expense
(5.5)
(3.9)
(4.9)
Net income
2.7%
8.8%
9.8%
Year Ended December 31,
2009 2008 2007
Passengers Carried
3,970,278
4,017,554
3,905,384
Passenger Cruise Days
28,503,046 27,657,578
26,594,515
APCD
27,821,224
26,463,637
25,155,768
Occupancy
102.5%
104.5%
105.7%