Royal Caribbean Cruise Lines 2009 Annual Report Download - page 48
Download and view the complete annual report
Please find page 48 of the 2009 Royal Caribbean Cruise Lines annual report below. You can navigate through the pages in the report by either clicking on the pages listed below, or by using the keyword search tool below to find specific information within the annual report.-
 1
1 -
2
-
3
-
4
-
5
-
6
-
7
-
8
-
9
-
10
-
11
-
12
-
13
-
14
-
15
-
16
-
17
-
18
-
19
-
20
-
21
-
22
-
23
-
24
-
25
-
26
-
27
-
28
-
29
-
30
-
31
-
32
-
33
-
34
-
35
-
36
-
37
-
 38
38 -
 39
39 -
 40
40 -
 41
41 -
 42
42 -
 43
43 -
 44
44 -
 45
45 -
 46
46 -
 47
47 -
 48
48 -
 49
49 -
 50
50 -
 51
51 -
 52
52 -
 53
53 -
 54
54 -
 55
55 -
 56
56 -
 57
57 -
 58
58 -
59
-
60
-
61
-
62
-
63
-
64
-
65
-
66
-
67
-
68
-
69
-
70
-
71
-
72
-
73
-
74
-
75
-
76
-
77
-
78
-
79
-
80
-
81
-
82
-
83
-
84
-
85
-
86
-
87
-
88
-
89
-
90
-
91
-
92
-
93
-
94
-
95
-
96
-
97
-
98
-
99
-
100
-
101
-
102
-
103
-
104
-
105
-
106
-
107
-
108
-
109
 |
 |

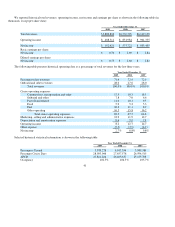
Onboard and other expenses consist of the direct costs associated with onboard and other revenues. These costs include the cost
of products sold onboard our ships, vacation protection insurance premiums, costs associated with pre- and post-cruise tours and
related credit card fees. These costs also include minimal costs associated with concession revenues, as the costs are mostly incurred
by third-party concessionaires.
Payroll and related expenses consist of costs for shipboard personnel.
Food expenses include food costs for both passengers and crew.
Fuel expenses include fuel and related delivery and storage costs, including the financial impact of fuel swap agreements.
Other operating expenses consist primarily of operating costs such as repairs and maintenance, port costs that do not vary with
passenger head counts, vessel operating lease costs, costs associated with Pullmantur’s land-based tours, vessel related insurance and
entertainment.
We do not allocate payroll and related costs, food costs, fuel costs or other operating costs to the expense categories attributable
to passenger ticket revenues or onboard and other revenues since they are incurred to provide the total cruise vacation experience.
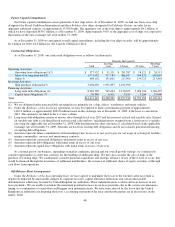
Non-GAAP Financial Measures
Available Passenger Cruise Days (“APCD”) is our measurement of capacity and represents double occupancy per cabin
multiplied by the number of cruise days for the period. We use this measure to perform capacity and rate analysis to identify our main
non-capacity drivers which cause our cruise revenue and expenses to vary.
Gross Cruise Costs represent the sum of total cruise operating expenses plus marketing, selling and administrative expenses.
Gross Yields represent total revenues per APCD.
Net Cruise Costs represent Gross Cruise Costs excluding commissions, transportation and other expenses and onboard and other
expenses (each of which is described above under the Terminology heading). In measuring our ability to control costs in a manner
that positively impacts net income, we believe changes in Net Cruise Costs to be the most relevant indicator of our performance. A
reconciliation of historical Gross Cruise Costs to Net Cruise Costs is provided below under Summary of Historical Results of
Operations. We have not provided a quantitative reconciliation of projected Gross Cruise Costs to projected Net Cruise Costs due to
the significant uncertainty in projecting the costs deducted to arrive at this measure. Accordingly, we do not believe that reconciling
information for such projected figures would be meaningful.
Net Debt-to-Capital is a ratio which represents total long-term debt, including current portion of long-term debt, less cash and
cash equivalents (“Net Debt”) divided by the sum of Net Debt and total shareholders’ equity. We believe Net Debt and Net Debt-to-
Capital, along with total long-term debt and shareholders’ equity are useful measures of our capital structure. A reconciliation of
historical Debt-to-Capital to Net Debt-to-Capital is provided below under Summary of Historical Results of Operations.
Net Revenues represent total revenues less commissions, transportation and other expenses and onboard and other expenses
(each of which is described under the Terminology heading).
Net Yields represent Net Revenues per APCD. We utilize Net Revenues and Net Yields to manage our business on a day-to-day
basis as we believe that it is the most relevant measure of our pricing performance because it reflects the cruise revenues earned by us
net of our most significant variable costs, which are commissions, transportation and other expenses and onboard and other expenses.
A reconciliation of historical Gross Yields to Net Yields is provided below under Summary of Historical Results of Operations. We
have not provided a quantitative reconciliation of projected Gross Yields to projected Net Yields due to the significant uncertainty in
projecting the costs deducted to arrive at this measure. Accordingly, we do not believe that reconciling information for such projected
figures would be meaningful.
38