Royal Caribbean Cruise Lines 2009 Annual Report Download - page 106
Download and view the complete annual report
Please find page 106 of the 2009 Royal Caribbean Cruise Lines annual report below. You can navigate through the pages in the report by either clicking on the pages listed below, or by using the keyword search tool below to find specific information within the annual report.-
 1
1 -
2
-
3
-
4
-
5
-
6
-
7
-
8
-
9
-
10
-
11
-
12
-
13
-
14
-
15
-
16
-
17
-
18
-
19
-
20
-
21
-
22
-
23
-
24
-
25
-
26
-
27
-
28
-
29
-
30
-
31
-
32
-
33
-
34
-
35
-
36
-
37
-
38
-
39
-
40
-
41
-
42
-
43
-
44
-
45
-
46
-
47
-
48
-
49
-
50
-
51
-
52
-
53
-
54
-
55
-
56
-
57
-
58
-
59
-
60
-
61
-
62
-
63
-
64
-
65
-
66
-
67
-
68
-
69
-
70
-
71
-
72
-
73
-
74
-
75
-
76
-
77
-
78
-
79
-
80
-
81
-
82
-
83
-
84
-
85
-
86
-
87
-
88
-
89
-
90
-
91
-
92
-
93
-
94
-
95
-
 96
96 -
 97
97 -
 98
98 -
 99
99 -
 100
100 -
 101
101 -
 102
102 -
 103
103 -
 104
104 -
 105
105 -
 106
106 -
 107
107 -
 108
108 -
 109
109
 |
 |

ROYAL CARIBBEAN CRUISES LTD.
NOTES TO THE CONSOLIDATED FINANCIAL STATEMENTS—(Continued)
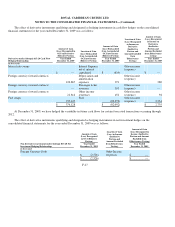
Note 17. Quarterly Selected Financial Data (Unaudited)
F-33
(In thousands, exce
p
t
p
er share data)
First Quarter Second Quarter Third Quarter Fourth Quarter
2009 2008 2009 2008 2009 2008 2009 2008
Total revenues
$1,325,602
$1,429,085
$1,349,015
$1,583,774
$1,763,542
$2,063,389
$1,451,667
$1,456,277
Operating income
$44,253
$ 137,568
$55,062
$ 168,950
$ 306,841
$ 461,907
$82,355
$63,559
Net income (loss)
$(36,238) $75,607
$(35,086) $84,749
$230,392
$411,887
$3,353
$1,479
Earnings (Loss) per share:
Basic
$(0.17)
$0.35
$(0.16)
$0.40
$1.08
$1.93
$0.02
$0.01
Dilute
d
$(0.17)
$0.35
$(0.16)
$0.40
$1.07
$1.92
$0.02
$0.01
Dividends declared per
share
$
—
$0.15
$
—
$0.15
$
—
$0.15
$
—
$
—
Our revenues are seasonal based on the demand for cruises. Demand is strongest for cruises during the Northern Hemisphere’s
summer months and holidays.
The first quarter of 2009 included a $7.1 million adjustment representing the cumulative reduction in fair value of certain
interest rate swaps during 2007 and 2008 due to an error in data embedded in the interest rate swap valuation software we use.
The third quarter of 2009 included a $12.3 million adjustment representing the cumulative reduction in a deferred tax liability
due to the change in Spanish statutory tax rates enacted in 2006.
1
2,3
1
2
3