Royal Caribbean Cruise Lines 2009 Annual Report Download - page 13
Download and view the complete annual report
Please find page 13 of the 2009 Royal Caribbean Cruise Lines annual report below. You can navigate through the pages in the report by either clicking on the pages listed below, or by using the keyword search tool below to find specific information within the annual report.-
 1
1 -
2
-
 3
3 -
 4
4 -
 5
5 -
 6
6 -
 7
7 -
 8
8 -
 9
9 -
 10
10 -
 11
11 -
 12
12 -
 13
13 -
 14
14 -
 15
15 -
 16
16 -
 17
17 -
 18
18 -
 19
19 -
 20
20 -
 21
21 -
 22
22 -
 23
23 -
24
-
25
-
26
-
27
-
28
-
29
-
30
-
31
-
32
-
33
-
34
-
35
-
36
-
37
-
38
-
39
-
40
-
41
-
42
-
43
-
44
-
45
-
46
-
47
-
48
-
49
-
50
-
51
-
52
-
53
-
54
-
55
-
56
-
57
-
58
-
59
-
60
-
61
-
62
-
63
-
64
-
65
-
66
-
67
-
68
-
69
-
70
-
71
-
72
-
73
-
74
-
75
-
76
-
77
-
78
-
79
-
80
-
81
-
82
-
83
-
84
-
85
-
86
-
87
-
88
-
89
-
90
-
91
-
92
-
93
-
94
-
95
-
96
-
97
-
98
-
99
-
100
-
101
-
102
-
103
-
104
-
105
-
106
-
107
-
108
-
109
 |
 |

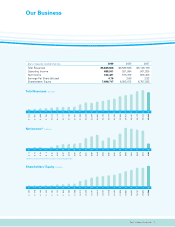
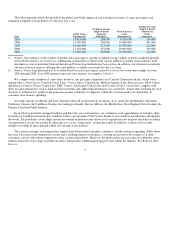
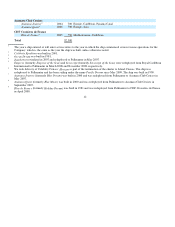
The following table details the growth in the global and North American cruise markets in terms of cruise passengers and
estimated weighted-average berths over the past five years:
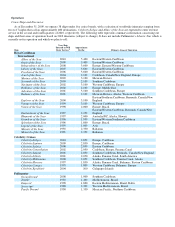
We compete with a number of cruise lines; however, our principal competitors are Carnival Corporation & plc, which owns,
among others, Aida Cruises, Carnival Cruise Lines, Costa Cruises, Cunard Line, Holland America Line, Iberocruceros, P&O Cruises
and Princess Cruises; Disney Cruise Line; MSC Cruises; Norwegian Cruise Line and Oceania Cruises. Cruise lines compete with
other vacation alternatives such as land-based resort hotels and sightseeing destinations for consumers’ leisure time. Demand for such
activities is influenced by political and general economic conditions. Companies within the vacation market are dependent on
consumer discretionary spending.
Our ships operate worldwide and have itineraries that call on destinations in Alaska, Asia, Australia, the Bahamas, Bermuda,
California, Canada, the Caribbean, Europe, the Galapagos Islands, Hawaii, Mexico, the Middle East, New England, New Zealand, the
Panama Canal and South America.
In an effort to penetrate untapped markets and diversify our customer base, we continue to seek opportunities to redeploy ships
in our Royal Caribbean International, Celebrity Cruises and Azamara Club Cruises brands to new markets and itineraries throughout
the world. The portability of our ships and our investment in infrastructure allows us to expand into new markets and helps us reduce
our dependency on any one market by allowing us to create “home ports” around the world. In addition, it allows us to readily
redeploy our ships to meet demand within our existing cruise markets.
The current economic environment has significantly deteriorated consumer confidence and discretionary spending. While there
has been a decrease in the demand for cruises and a resulting drop in cruise prices, cruising has proven to be resilient as it offers
consumers a good value when compared to other vacation alternatives. However, the projected increase in capacity within the cruise
industry from new cruise ships currently on order could produce additional pricing pressures within the industry. See Item 1A. Risk
Factors.
4
Year
Global Cruise
Passen
g
ers(1)
Weighted-Average
Supply of Berths
Marketed
Globall
y
(1)
North American
Cruise
Passen
g
ers(2)
Weighted-Average
Supply of Berths
Marketed in
North
America(1)
2005
14,818,000
288,000
9,909,000
190,000
2006
15,309,000
304,000
10,080,000
201,000
2007
16,586,000
327,000
10,330,000
212,000
2008
17,184,000
347,000
10,093,000
219,000
2009
17,340,000
363,000
10,169,000
222,000
1) Source: Our estimates of the number of global cruise passengers, and the weighted-average supply of berths marketed globally
and in North America are based on a combination of data that we obtain from various publicly available cruise industry trade
information sources including Seatrade Insider and Cruise Line International Association. In addition, our estimates incorporate
our own statistical analysis utilizing the same publicly available cruise industry data as a base.
2) Source: Cruise Line International Association based on cruise passengers carried for at least two consecutive nights for years
2005 through 2008. Year 2009 amounts represent our estimates (see number 1 above).