Royal Caribbean Cruise Lines 2009 Annual Report Download - page 55
Download and view the complete annual report
Please find page 55 of the 2009 Royal Caribbean Cruise Lines annual report below. You can navigate through the pages in the report by either clicking on the pages listed below, or by using the keyword search tool below to find specific information within the annual report.-
 1
1 -
2
-
3
-
4
-
5
-
6
-
7
-
8
-
9
-
10
-
11
-
12
-
13
-
14
-
15
-
16
-
17
-
18
-
19
-
20
-
21
-
22
-
23
-
24
-
25
-
26
-
27
-
28
-
29
-
30
-
31
-
32
-
33
-
34
-
35
-
36
-
37
-
38
-
39
-
40
-
41
-
42
-
43
-
44
-
 45
45 -
 46
46 -
 47
47 -
 48
48 -
 49
49 -
 50
50 -
 51
51 -
 52
52 -
 53
53 -
 54
54 -
 55
55 -
 56
56 -
 57
57 -
 58
58 -
 59
59 -
 60
60 -
 61
61 -
 62
62 -
 63
63 -
 64
64 -
 65
65 -
66
-
67
-
68
-
69
-
70
-
71
-
72
-
73
-
74
-
75
-
76
-
77
-
78
-
79
-
80
-
81
-
82
-
83
-
84
-
85
-
86
-
87
-
88
-
89
-
90
-
91
-
92
-
93
-
94
-
95
-
96
-
97
-
98
-
99
-
100
-
101
-
102
-
103
-
104
-
105
-
106
-
107
-
108
-
109
 |
 |

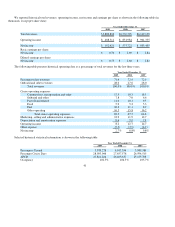
Other expense increased to $33.1 million in 2009 compared to other income of $54.9 million in 2008 for a net change of $88.0
million when comparing these periods. The change was primarily due to $21.1 million in foreign currency exchange losses in 2009 as
compared to $23.0 million in foreign currency exchange gains in 2008, for a net change of $44.1 million when comparing these
periods. This change was primarily due to the dramatic movements in exchange rates during the latter half of 2008 and most of 2009.
In addition, we had $15.2 million in losses from our equity method investments in 2009 as compared to $4.0 million in gains from our
equity method investments in 2008, for a net change of $19.2 million when comparing these periods. This change was primarily due
to the start-up of operations of one of our investments. The change in other income (expense) was also due to a $17.6 million
settlement gain received in the case against Pentair Water Treatment (OH) Company (formerly known as Essef Corporation) during
2008 that did not recur in 2009. These changes were offset by an out of period adjustment recorded in 2009 of $12.3 million to correct
an error in our deferred tax liability. The out of period adjustment represents the cumulative reduction to a deferred tax liability due to
the change in the enacted Spanish statutory tax rate used to calculate the liability in 2006 which was identified during the third quarter
of 2009.
Net Yields
Net Yields decreased 14.2% in 2009 compared to 2008 primarily due to the higher discounts on our ticket prices, the decrease in
onboard spending, a stronger United States dollar compared to the euro, British pound and Canadian dollar as well as the impact of
the itinerary modifications and diminished demand for our cruises and tours to Mexico and the Caribbean as mentioned above.
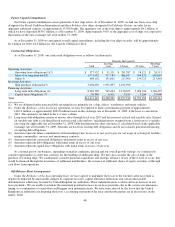
Net Cruise Costs
Net Cruise Costs decreased 5.2% in 2009 compared to 2008 due to a 9.8% decrease in Net Cruise Cost per APCD offset by the
5.1% increase in capacity mentioned above. The decrease in Net Cruise Costs per APCD was primarily driven by the decrease in fuel
expenses, the decrease in air and tour expenses and the decrease in marketing, selling and administrative expenses.
Year Ended December 31, 2008 Compared to Year Ended December 31, 2007
Revenues
Total revenues for 2008 increased $383.4 million or 6.2% to $6.5 billion from $6.1 billion in 2007. Approximately $319.7
million of this increase is attributable to an increase in capacity of 5.2%. The increase in capacity is primarily due to the addition of
I
ndependence of the Seas, which entered service in May 2008, a full year of Liberty of the Seas, which entered service in May 2007,
the addition of Ocean Dream, which entered service in March 2008, and the addition of Celebrity Solstice, which entered service in
November 2008. The remaining increase of $63.7 million is due primarily to an increase in ticket prices partially offset by a decrease
in onboard and other revenues. The decrease in onboard and other revenues is due primarily to a decrease in spending on a per
passenger basis.
Onboard and other revenues included concession revenues of $230.8 million in 2008 compared to $239.3 million for the same
period in 2007. The decrease in concession revenues was primarily due to a decrease in spending on a per passenger basis partially
offset by the increase in capacity mentioned above.
Cruise Operating Expenses
Total cruise operating expenses for 2008 increased $422.0 million or 10.6% to $4.4 billion from $4.0 billion for 2007.
Approximately $207.0 million of this increase is attributable to the 5.2% increase in capacity. The remaining increase of $215.0
million was primarily driven by increases in fuel expenses, and to a lesser extent payroll and related expenses. Fuel expenses, which
are net of the financial impact of fuel swap agreements, increased 30.0% per metric ton in 2008 as compared to 2007 primarily as a
result of increasing fuel prices. As a percentage of total revenues, fuel expenses were 11.1% and 8.9% in 2008 and 2007, respectively.
The increase in payroll and related expenses was associated with benefits and higher staffing levels.
45